
Portfolio View
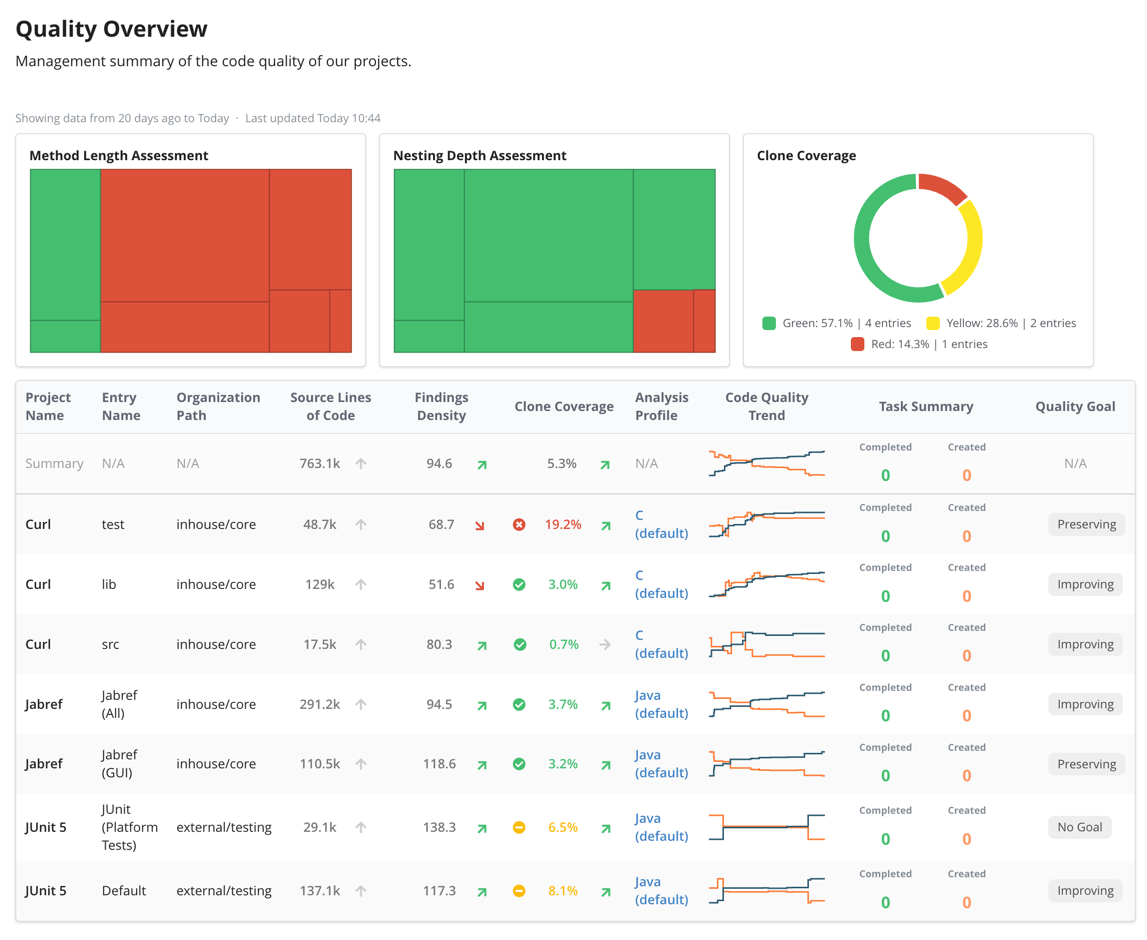
If you are responsible for a portfolio of projects, you need to keep an eye on all those projects without going through each project one by one. The Portfolio view of the Dashboard perspective gives you a high-level overview of the quality of a selection of projects on a single page and shows which ones need attention. Use it, for example, to track whether teams meet their quality goals, to prioritize refactoring and testing effort across projects, or to report the quality of a department or product line to management.
Portfolio Entries
A portfolio entry is a part of a project, defined by a branch and a path, with its own threshold profile, quality goal and organization path. Each row of a portfolio corresponds to one portfolio entry.
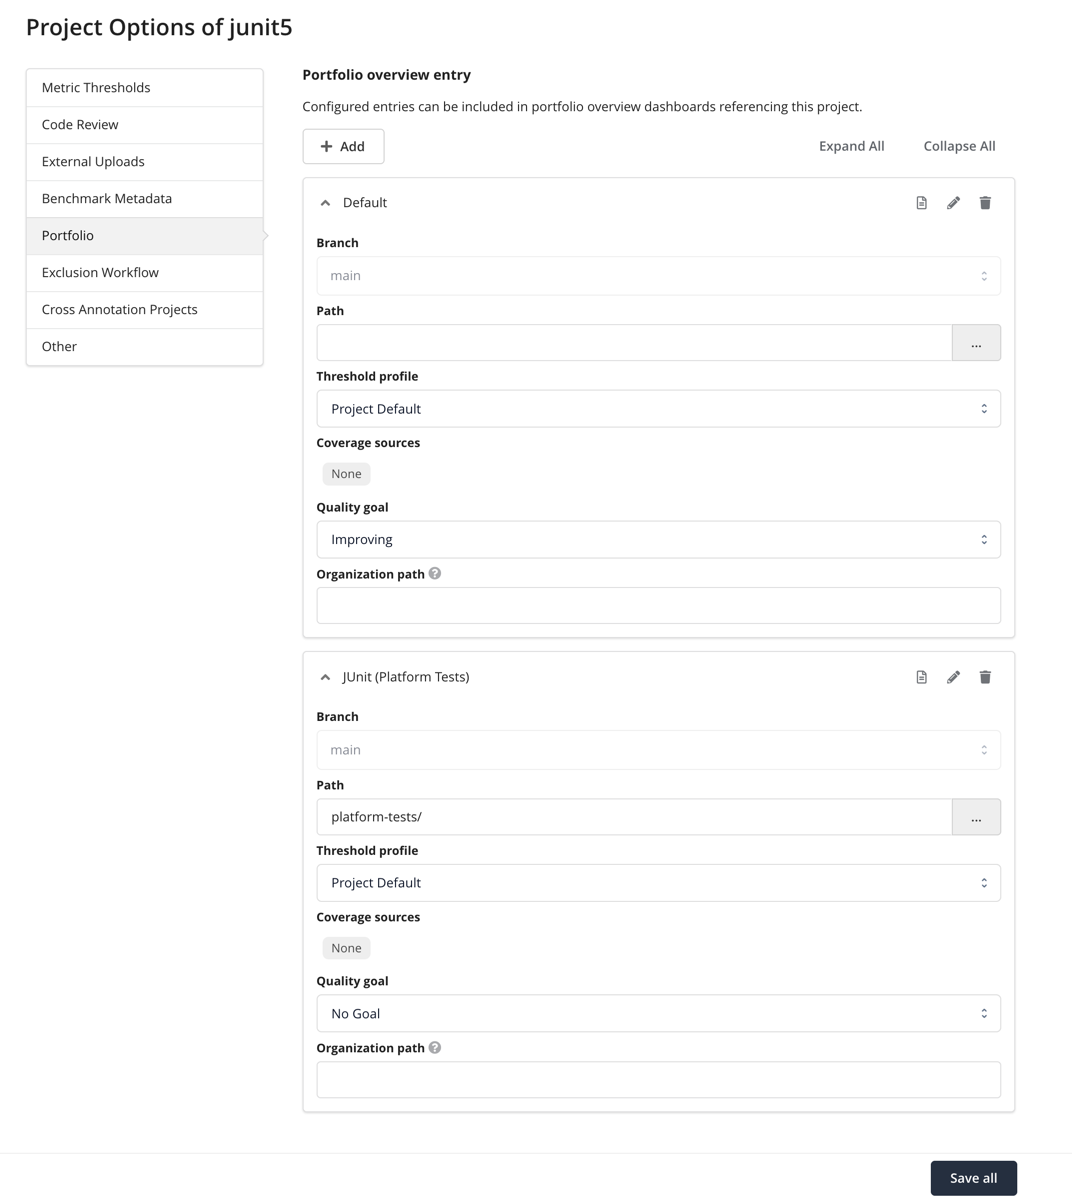
You configure the entries in the project options of each project:
- Open the Projects view and click next to the project.
- In the Project Options view, open the category Portfolio.
- Edit the option Portfolio overview entry.
The Default Entry
Every project has an entry named Default which is created together with the project. The Default entry covers the whole project and uses the threshold profile of the project. So every project appears in portfolio overviews without further configuration.
If you remove the Default entry, the project contributes only its custom entries. A project without any entry does not appear in any portfolio overview.
Custom Entries
Add custom entries to assess parts of a project separately. For example, split a monorepo into its frontend/ and backend/ folders, or add an entry for a release branch.
- Click Add and enter a name for the new entry. The name appears in the Entry name column and in the query field
entryName. - Click to rename an entry. Manual assessments stay attached to the entry when you rename it.
- Click to remove an entry.
Entry Settings
Each entry has the following settings:
| Setting | Meaning |
|---|---|
| Branch | The branch the entry covers. Leave it empty to use the preselected branch of the project, or its default branch if the project preselects none. |
| Path | The path within the project. All metrics, findings, test gaps and treemaps of the entry cover only this path. The default is /, the whole project. |
| Threshold profile | The threshold profile that assesses the metrics of the entry. It decides the traffic-light colors of the metric columns and visuals. |
| Coverage sources | The coverage partitions that the Test gap column uses. Keep All, the default, to use every partition. |
| Quality goal | The quality goal of the entry. See Quality Goals. |
| Organization path | Where the entry sits in your organization, for example Automotive/Infotainment/Navigation. See Organization Path. |
Quality Goals
A quality goal states how strictly the findings of an entry are managed. The Quality goal column checks whether the entry met its goal between the start date and the end date of the overview.
| Quality goal | Description | The goal is met when … |
|---|---|---|
| No Goal | Project has no quality goal. | always. |
| Preserving | No new findings. | no findings were added. |
| Improving | No new findings and no findings in modified code. | no findings were added and no findings remain in changed code. |
| Perfective | No findings in the codebase. | no findings remain at the end date. |
| Not Set | Quality goal not set or undefined. | never. The assessment is unknown. |
Organization Path
The organization path places an entry in the hierarchy of your organization. Write it as a slash-separated path from the broadest unit down to the most specific one.
Treemaps in portfolio overviews nest their entries along this hierarchy, with one box per segment. The path uses the project ID, not the project name. For example, an entry Frontend in the project with the ID maps and the organization path Automotive/Infotainment/Navigation appears as Automotive/Infotainment/Navigation/maps/Frontend. An entry with the organization path Automotive/Infotainment/Radio appears next to it inside the same Infotainment box. Leave the organization path empty to group the entry by its project only.
Example
Project Maps contains a web frontend in the folder frontend/. To assess the frontend separately, add an entry Frontend with these settings:
- Path:
frontend/ - Quality goal: Improving
- Organization path:
Automotive/Infotainment/Navigation
Keep the Default entry to also show the whole project. An overview with the query entryName = 'Frontend' shows only the frontend entries of all projects.
Portfolio View
The Portfolio view displays a single portfolio overview. By default, Teamscale opens the overview you viewed last.
The top bar contains the overview selector. Type into the selector to filter the overviews by name or group. Turn on Only my overviews to show only the overviews you own.
Below the title and the description of the overview, a line states the time range of the overview, for example "Showing data from 90 days ago to Today". Next to it, Teamscale shows when it last computed the values:
| Status | Meaning |
|---|---|
| Queued… | The computation waits to start. |
| Recalculating… | Teamscale computes the values. The table updates when the computation finishes. |
| Last updated … | The values are complete as of this time. |
| Last pre-computation failed | The last computation failed. Hover over the status to see the reason. The table keeps the values of the last successful computation. |
See When Values Are Updated for when Teamscale computes the values.
Click a column header to sort the table by that column. Cells without a value always appear at the end.
Some cells show a placeholder instead of a value:
| Placeholder | Meaning |
|---|---|
| A pulsing bar | Teamscale computes this value for the first time. |
| — | The value has not been computed yet. Teamscale computes it on the next computation run. |
| N/A | The value does not exist for this entry, for example because the analysis profile of the project disables the metric. |
| A red warning | The computation of this value failed. Hover over the icon to see the reason. |
The pencil menu next to the overview selector contains the following actions. Teamscale shows only the actions that you have permission for.
| Action | Description | Required permission |
|---|---|---|
| Edit overview | Opens the Edit Portfolio Overview View. | Role Editor or Owner |
| Rename... | Renames the overview. | Role Editor or Owner |
| Delete | Deletes the overview after a confirmation. | Role Owner |
| Change permissions | Opens the role assignment of the overview. | Role Owner |
| Save copy as... | Saves a copy of the overview under a new name. | Global permission Create Portfolio Overviews |
| Recalculate now | Computes all values of the overview again. | Role Editor or Owner |
For the roles, see Sharing a Portfolio Overview.
Creating a Portfolio Overview
Click the + button next to the overview selector to create a new portfolio overview. If no overview exists yet, click Create portfolio overview instead. Both buttons require the global permission Create Portfolio Overviews. The default role Portfolio Overview Manager grants this permission, see Permission Management.
The new overview starts with a time range of the last 90 days, an empty query and a set of default columns. Continue in the Edit Portfolio Overview View.
Filtering by a Visual
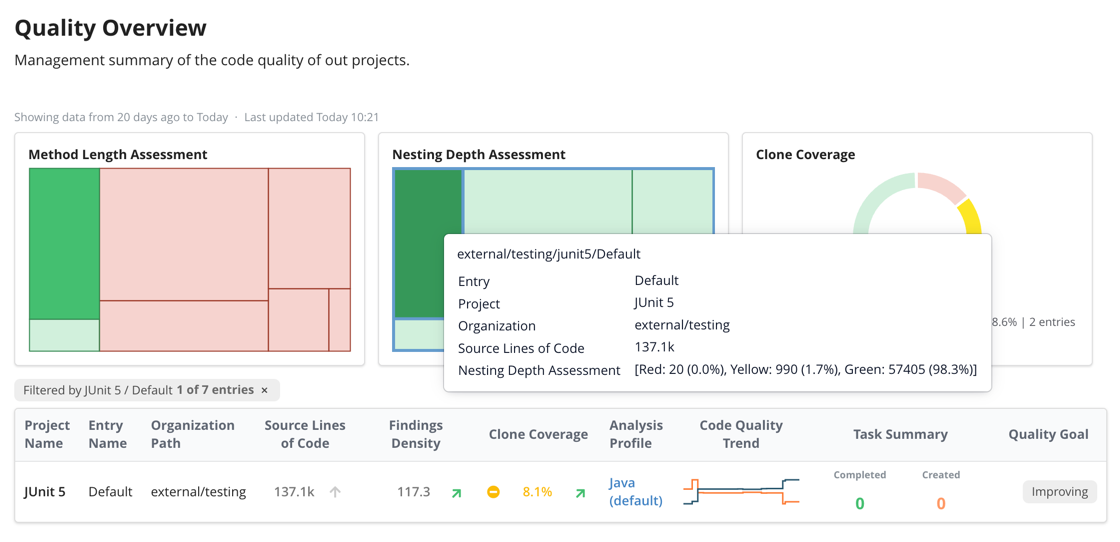
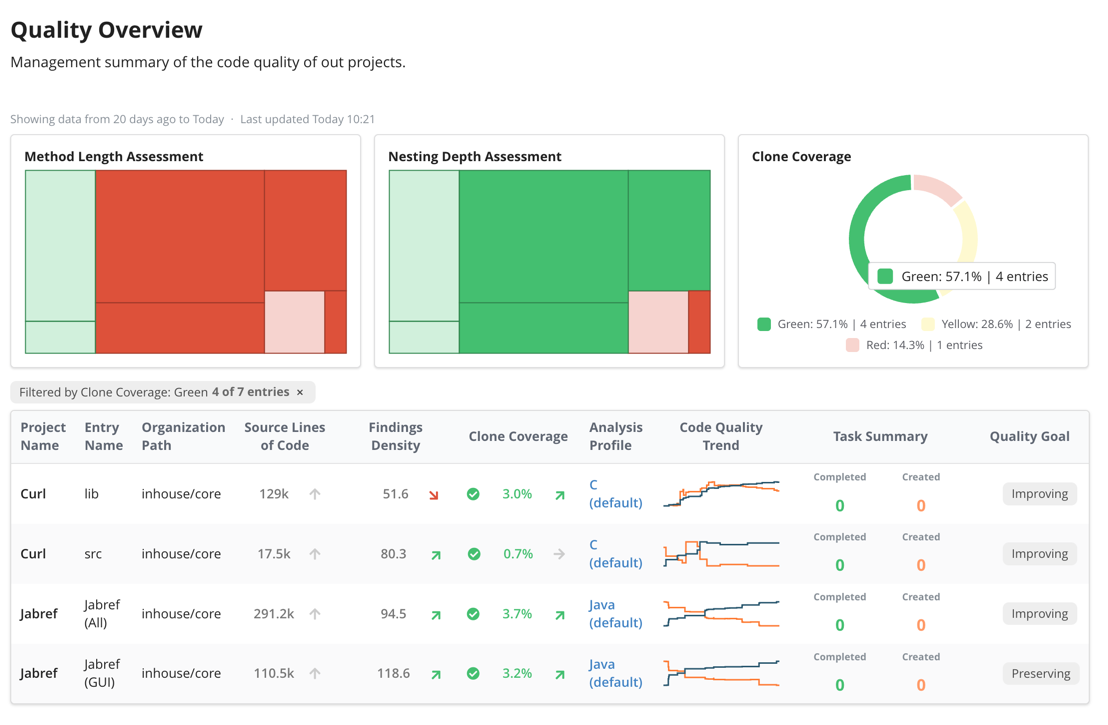
Click a box in a treemap or a slice in an assessment distribution to filter the table. The table then shows only the matching entries. A chip above the table names the filter and the number of matching entries. Click the same element again or click × icon in the chip to show all entries.
Inspecting a Value
Click a cell to see more details:
- A Code metric cell opens a dialog with the trend of the metric over the time range and a treemap of the entry.
- A Test gap cell opens the test gap trend and the test gap treemap of the entry.
- A Manual assessment cell opens the history of manual assessments.
Edit Portfolio Overview View
The edit view shows a preview of the overview while you change it. It contains the following fields:
| Field | Description |
|---|---|
| Title | The title above the table. |
| Description | A description below the title. You can use Markdown. |
| Entry Query | Selects the entries of the overview. See Entry Query. |
| Start Date | The start of the time range. Trends, findings changes and test gaps compare the start date with the end date. |
| End Date | The end of the time range. Metric values are taken at the end date. |
| Show summary row | Adds a row that combines the values of all entries. See Summary Row. |
For the start and end date, you can choose a fixed point in time or a time span relative to today.
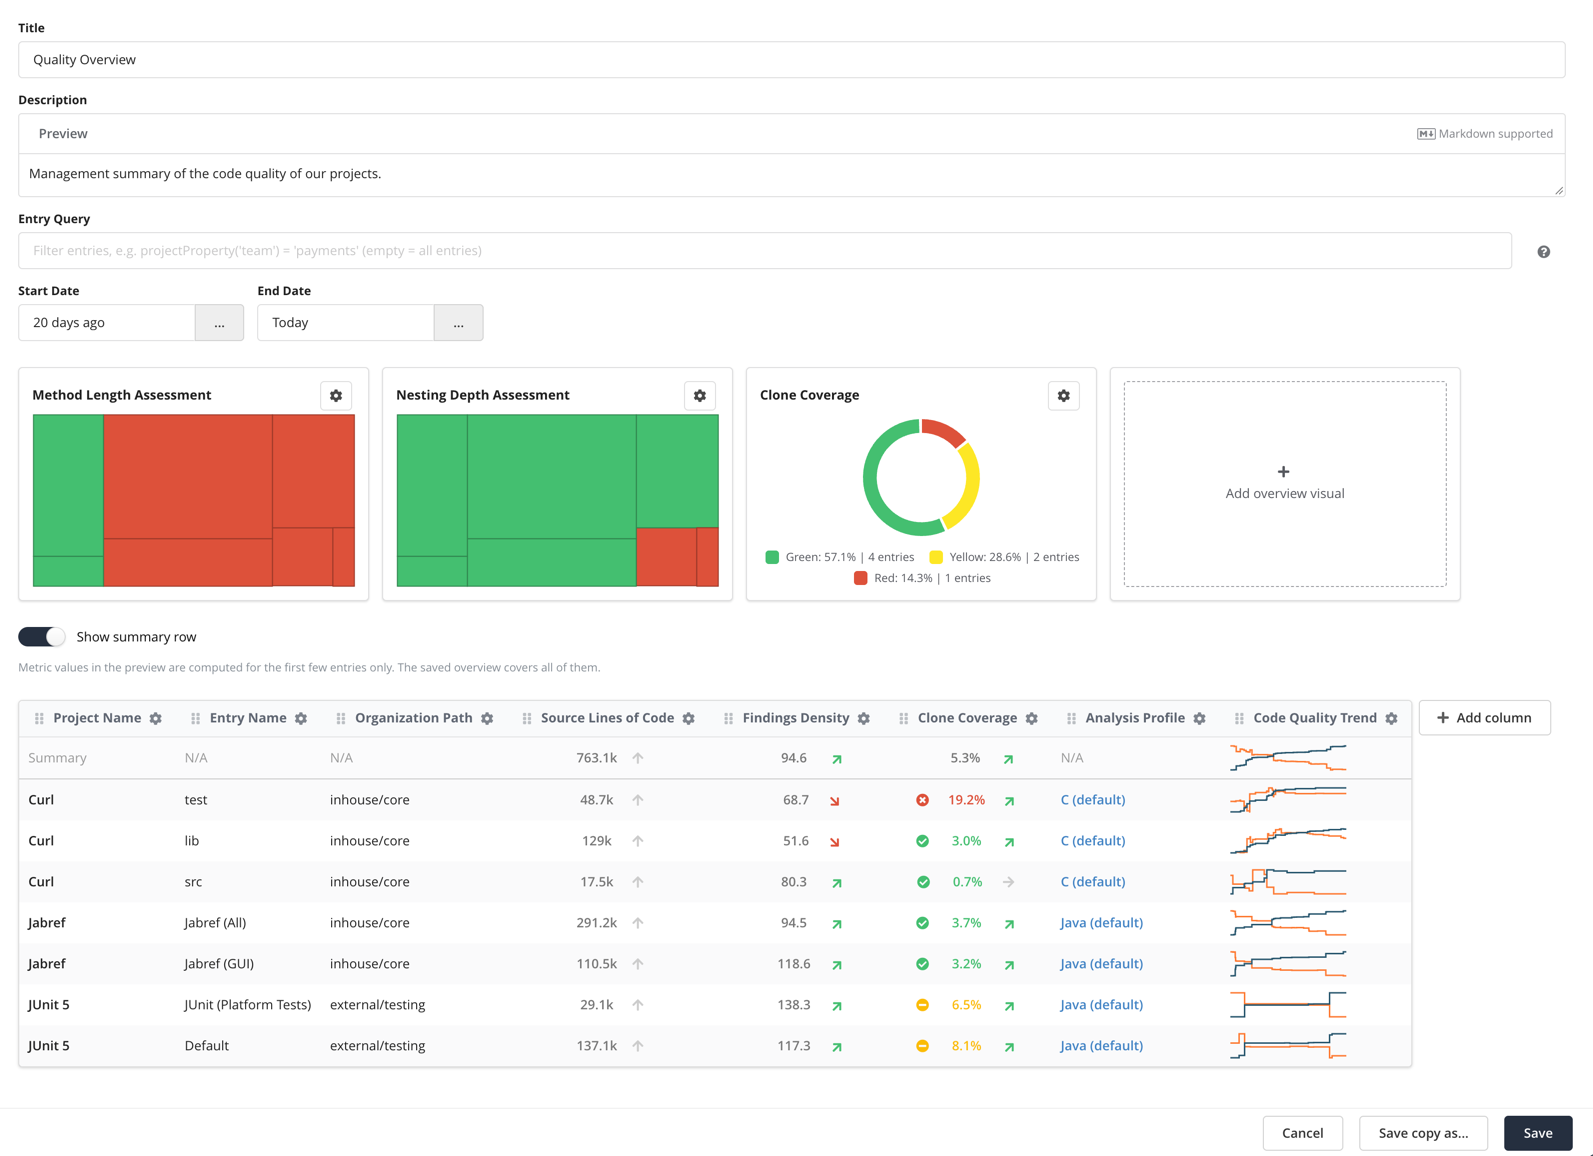
The preview computes the values of the pre-computed columns for the first few entries only. Once you save the overview, Teamscale computes all entries.
Click Save to save the overview. For a new overview, Teamscale asks for a Name and an optional Group. The group sorts the overview into a folder in the overview selector. Click Save copy as... to save the changes as a new overview and keep the original unchanged.
Entry Query
The entry query selects the portfolio entries of the overview. An empty query selects all entries. The overview only shows entries of projects that the viewer may see. Click the help icon next to the field to show the supported query syntax. The preview updates when you press Enter or leave the field.
Each portfolio entry has the following fields:
| Field | Content |
|---|---|
projectId | The primary public ID of the project. |
projectName | The display name of the project. |
entryName | The name of the portfolio entry. |
organizationPath | The organization path of the entry. |
thresholdProfile | The threshold profile of the entry. |
qualityGoal | The quality goal of the entry. |
The query language supports the following elements:
projectProperty('key')reads a project property. The key is a regular expression.- The comparison operators
=,!=,>,<,>=and<=compare a field with a value. Equality ignores case. inwith square brackets checks whether a field matches one of several values ignoring casing.~inwith square brackets checks whether the field value is a substring of one of the listed values ignoring casing. For example,entryName ~in [Frontend-App]matches the entryFrontend, butentryName ~in [Front]does not.~matches a field against a regular expression. The match is case-sensitive.&&(and),||(or) and!(not) combine conditions. Parentheses group them.- Quote values that contain spaces or special characters with single or double quotes.
The quality goals compare by their strictness: Not Set, No Goal, Preserving, Improving, Perfective.
Examples:
| Query | Selects |
|---|---|
entryName = 'Default' | The Default entry of every project. |
qualityGoal in [Improving, Perfective] | All entries with a strict quality goal. |
qualityGoal > 'No Goal' | All entries with a quality goal of Preserving or stricter. |
projectProperty('team') = 'payments' | All entries of projects whose property team is payments. |
organizationPath ~ '^Automotive/' | All entries below the organization unit Automotive. |
projectName ~ 'Pay.*Service' && entryName != 'Default' | All custom entries of the matching projects. |
Columns
Click Add column to add a column. The menu groups the column types into Metrics, Assessments, Metadata and Tasks. Every column has a Column Title. Teamscale fills in the title from your selection unless you enter a custom title.
In the edit view, each column header has two controls:
| Drag the grip handle to move the column to a new position. | |
| Opens the column settings. Click Remove column there to remove the column. |
The following column types are available:
| Column type | Group | Shows | Settings |
|---|---|---|---|
| Code metric | Metrics | The value of a metric at the end date. | Data (the metric), Show trend, Show assessment |
| Code quality trend | Metrics | A chart of Source Lines of Code and Findings Density over the time range. | – |
| Quality goal | Assessments | The quality goal of the entry. | Show assessment |
| Test gap | Assessments | The test gap of the entry, as in the Test Gaps perspective. | Assessment type, Hide unchanged methods |
| Manual assessment | Assessments | The selected manual assessment of the entry. | – |
| Project | Metadata | The name or the ID of the project. | Show |
| Entry name | Metadata | The name of the portfolio entry. | – |
| Organization path | Metadata | The organization path of the entry. | – |
| Analysis profile | Metadata | The analysis profile of the project. | – |
| Threshold profile | Metadata | The threshold profile of the entry, with a link to it. | – |
| Project property | Metadata | The value of a project property. | Project property |
| Task summary | Tasks | The number of tasks completed and created in the time range. | – |
Code Metric
The Data list contains the metrics of the analysis profiles of the selected projects. If Show assessment is on and the threshold profile of an entry defines a threshold for the metric, the cell shows a traffic-light color. Otherwise, the cell shows the value without color. Show trend adds an arrow that compares the value at the start date with the value at the end date.
Quality Goal
With Show assessment, the cell shows whether the entry met its quality goal, see Quality Goals. Hover over the cell to see the findings the assessment is based on: the findings added, the findings in changed code, the findings removed and the number of findings at the start and the end date.
Test Gap
The Assessment type selects what the column shows: Test Gap, Execution Only or Churn. The column uses the coverage sources of the entry.
Code Quality Trend
The chart shows Source Lines of Code and Findings Density from the start date to the end date. Each line uses its own scale, so you cannot compare the heights of the two lines. Sorting puts entries with growing code and falling findings density first.
Task Summary
The column shows the number of completed tasks in the time range of the portfolio in green and created tasks in orange. Completed tasks are tasks that were closed or discarded.
Summary Row
Turn on Show summary row to add a row labeled Summary at the top of the table. The summary row combines the values of all entries:
- Code metric combines the values the same way as the metric does for files and folders. It weights ratio metrics by Source Lines of Code. The cell shows a color only if all entries use the same threshold.
- Test gap combines the test gaps of all entries.
- Task summary counts the tasks of each project once.
- Code quality trend sums the source lines of code and averages the findings density weighted by source lines of code.
- The leftmost Project or Entry name column shows the label Summary.
- All other columns show N/A.
The summary row stays empty while a value of any entry is pending or missing.
Visuals
Visuals appear above the table. Click Add overview visual and select a visual type. Every visual has a Label. Click on a visual to edit it, and click Remove visual there to remove it.
Treemap
The treemap shows every entry as a box.
- Area sets the size of the boxes. Select a size metric, for example Source Lines of Code, Lines of Code or Files. You can also select a project property whose value is a number, for example a budget.
- Color sets the color of the boxes. Select a metric with a threshold or the manual assessment.
The treemap nests the boxes along the organization path and then by project. Gray boxes have no assessment. Hover over a box to see its entry, project, organization path and values.
Assessment Distribution
The assessment distribution is a pie chart that shows how many entries have which assessment. Assessment selects a metric with a threshold or the manual assessment. For a metric, the slices are Red, Orange, Yellow, Green and Unknown. For the manual assessment, the slices are the assessment values. Hover over a legend item to see the entries of that slice.
Manual Assessments
A manual assessment records your own judgment of a portfolio entry for a time range. Use it for criteria that Teamscale cannot measure, for example the result of a review. Manual assessments are attached to a portfolio entry so that all overviews that contain the entry show the same manual assessments.
Click a cell of a Manual assessment column to open the Manual Quality Assessments dialog. It lists all manual assessments of the entry, newest first. Click Select to choose which assessment the overviews show. Click to remove an assessment.
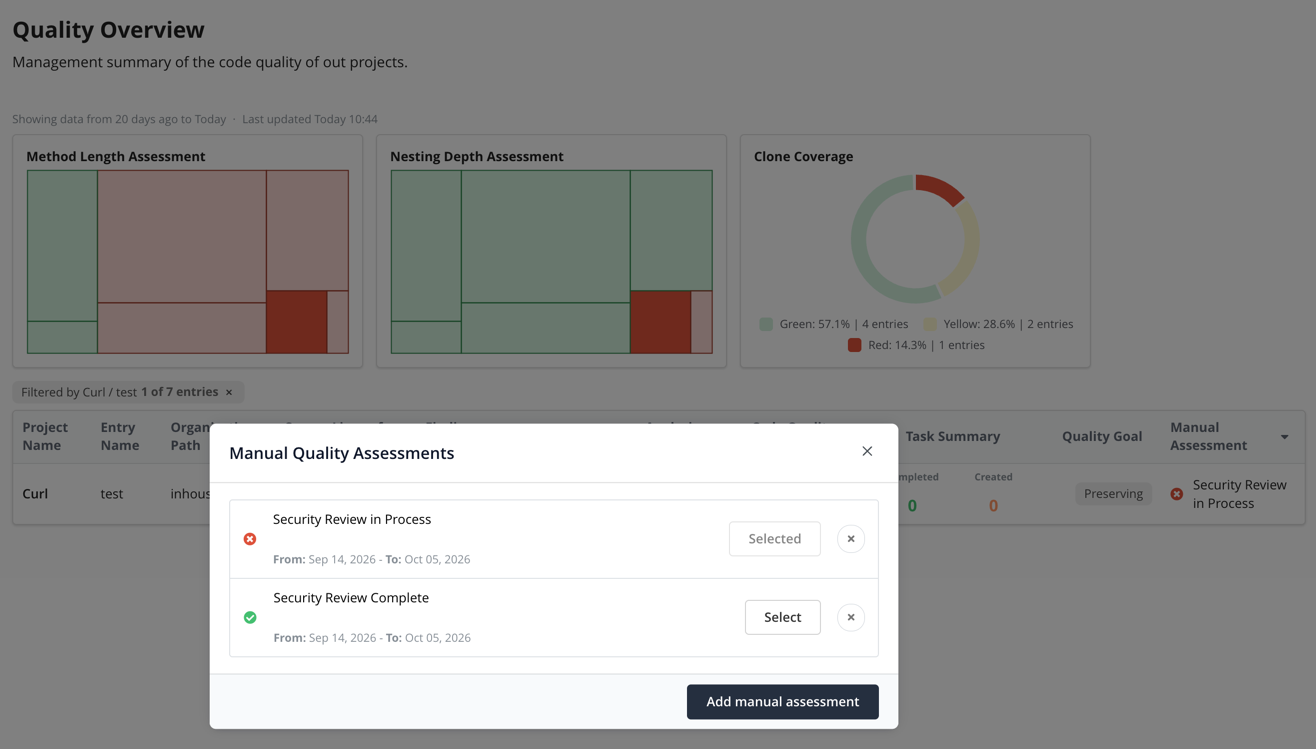
Click Add manual assessment to add an assessment. The new assessment becomes the selected one. It has the following fields:
| Field | Description |
|---|---|
| Timeframe | The time range of the overview. You cannot change it here. |
| Assessment | The assessment value, see below. |
| Summary | A short summary that the cell shows. Required. |
| Description | A longer explanation, shown in the dialog. |
Treemaps and assessment distributions can use the manual assessment as their color source.
Sharing a Portfolio Overview
When you create a portfolio overview, you become its owner. To share the overview, select Change permissions in the pencil menu. There, you assign roles to users or groups:
| Role | Permissions |
|---|---|
| Viewer | View the overview. |
| Editor | View and edit the overview, and start a new computation with Recalculate now. |
| Owner | View, edit and delete the overview, and assign roles to other users and groups. |
A user who views an overview sees only the entries of projects that the user may view.
When Values Are Updated
Teamscale computes most values of an overview in the background and stores them. This keeps the overview fast, even for many projects. Teamscale computes the values in the following cases:
- You create an overview.
- You click Recalculate now.
- You save changes to the start date, the end date or the entry query. Teamscale computes all values again.
- You save a new column or visual that needs new data. Teamscale keeps showing the current values while it computes the new data.
- Every night. An administrator can change this schedule with the server option Portfolio Overview Pre-Computation.
Values of the columns Project, Entry name, Organization path, Threshold profile, Project property and Manual assessment are always current.