Reports View since 5.6
In the Reports View, you can build quality reports reflecting the overall quality of your project. A quality report consists of individual slides that display e.g., findings, metrics, metric and trend charts, etc., from one or multiple of your project or multiple projects. Every slide is highly configurable and allows to display data for individual Teamscale projects, filter the data, add comments, etc.
More on Slide Types
For a complete overview of all slide types available in the report editor please refer to the Report Slides Overview
A flexible report editor allows editing the report at your convenience, with functions such as adding and removing, copying, pasting and duplicating slides, moving them per drag&drop, etc. Reports are saved in Teamscale for reference and later use. They can be printed or presented directly from Teamscale.
Permissions needed
The Reports View is not visible by default. In order to view the perspective, one of the following conditions has to be fulfilled:
- the user has been granted any Global Role that contains the Create Quality Reports permission (contained by default in the Project Creator, Instance Technical Quality Engineer, and Instance Admin global roles).
- the user has been granted at least the Viewer Role on at least one quality report.
Report List View
The default view of the Reports View is the Report List View:
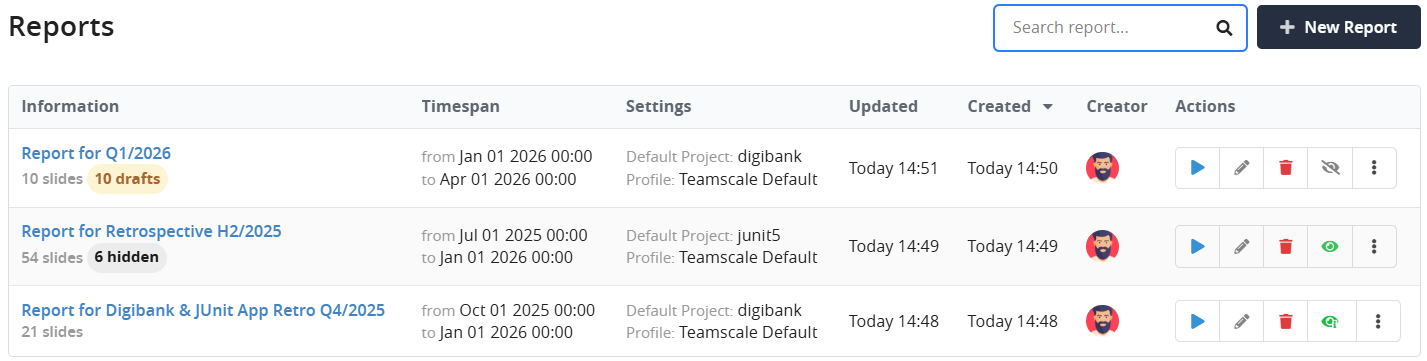
This view shows existing reports in a tabular fashion, with individual columns providing basic information on the quality report, such as report Timespan, basic Settings or the report's creator. The buttons in the report list table allow navigation to the Report Present View, Report Edit View, Basic Role View as well as copying or removing existing reports:
| Presents the report (full-screen). | |
| Navigate to the Report Edit View. | |
| Delete the report. | |
| Allows to provide view permissions for this report to all project members. Becomes if access was granted. | |
| other options (e.g., access settings and copy report settings). |
Opening a Report read-only
In order to view your report (without editing), you can click the report name in the Report List View.
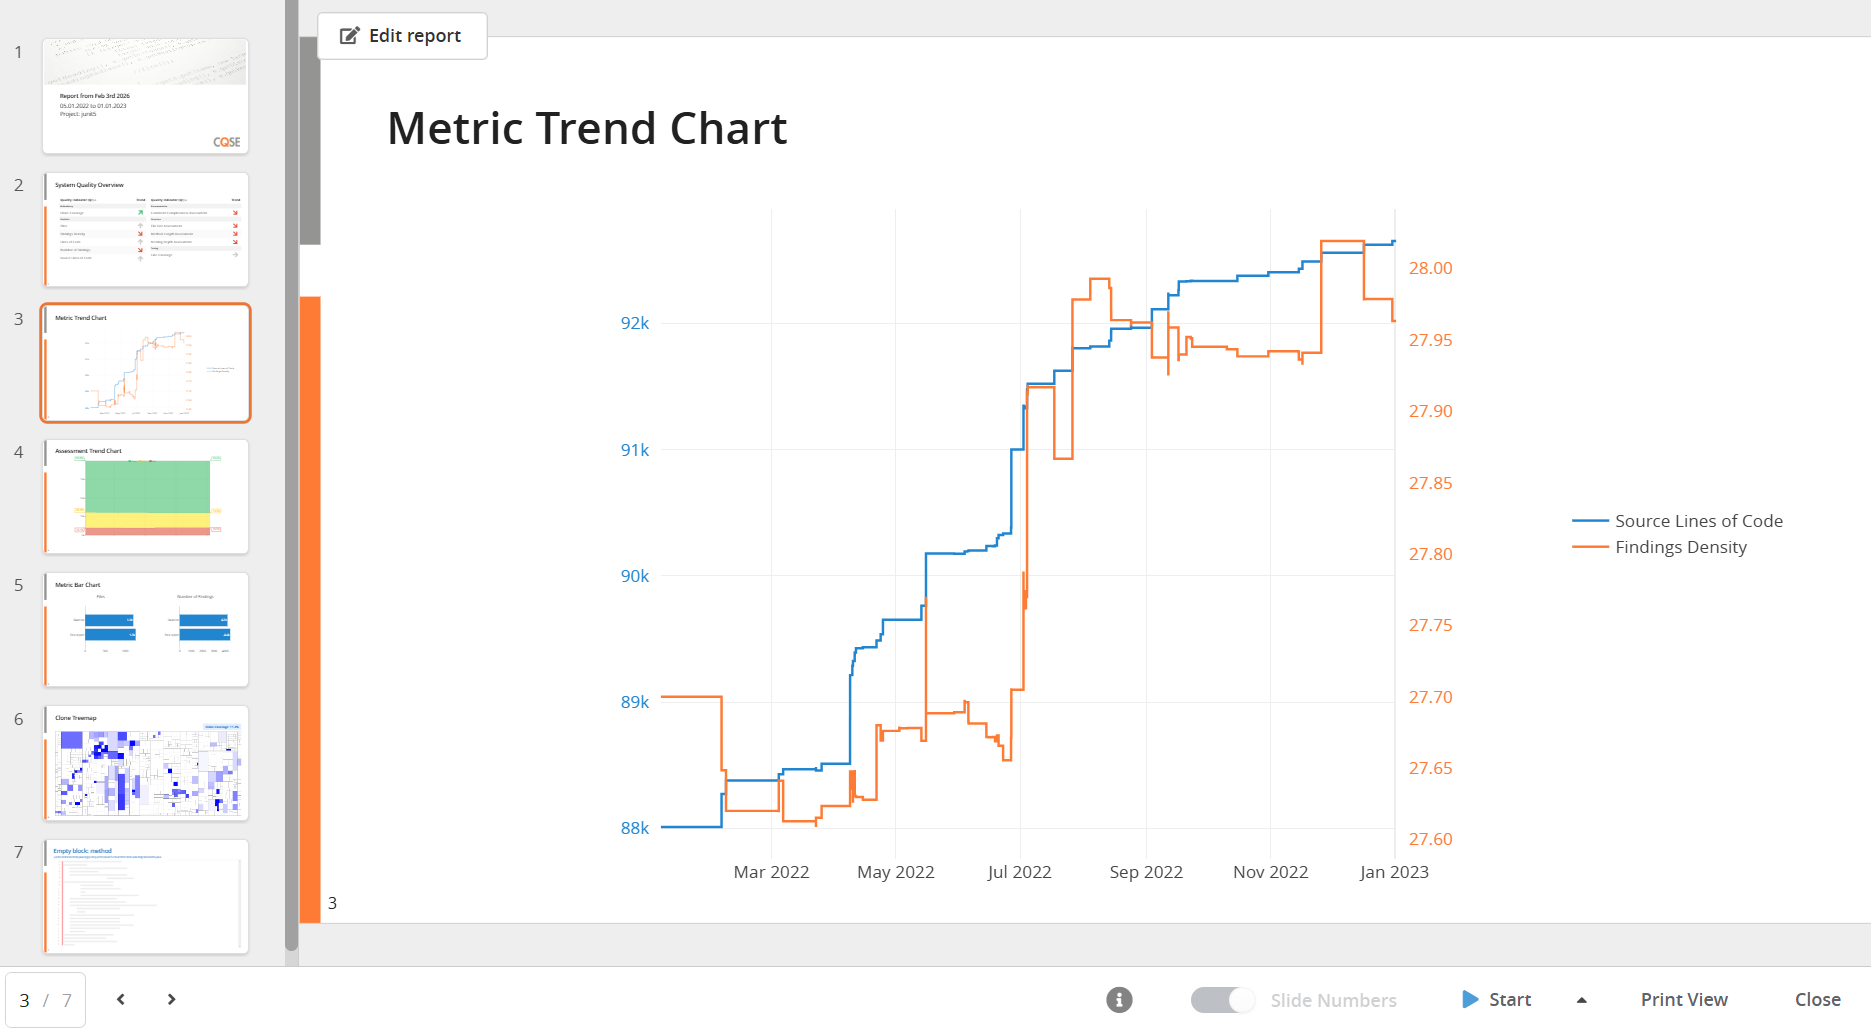
This is a simple view providing an overview of report slides as well as the possibility to select and view individual slides. In case you have the permission to edit the report, you will see the Edit report button.
Changing the Settings of a Slide
Each slide has a configuration window where you can select the slide settings. The slide settings can be specific to the slide type (e.g., filtering by task tag in the Quality Tasks Slide) as well as shared across multiple slide types, e.g., the slide Comments setting. An example of a slide settings window (from the Quality Tasks Slide) is:

Copying or Deleting Slides
Right-clicking on a slide in the preview list (left pane) opens a context menu for editing slides:
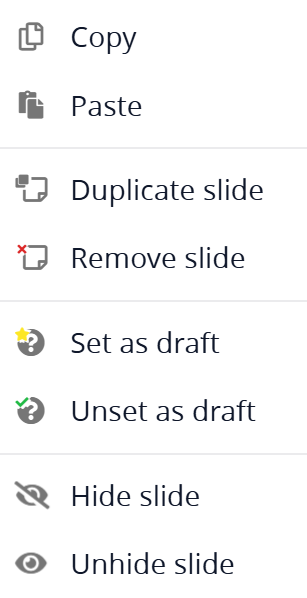
The remaining features are also available via shortcuts. Here is a comprehensive list of available shortcuts:
Quality Report Edit Shortcuts
| Delete | Remove current slide. |
| ↑ | Navigate to previous slide. |
| ↓ | Navigate to next slide. |
| Shift + ↑ | Select previous slide |
| Shift + ↓ | Select next slide |
| Ctrl + A | Select all slides |
| Ctrl + D | Duplicate current slide(s) |
| Ctrl + C | Copy current slide(s) |
| Ctrl + V | Paste copied slide(s) |
Setting Slide(s) as Draft
Marking one or more slides as "draft" is possible using the context menu (see image above) and will add a blue ribbon in the corner of the slide. This only serves as a visual marker, the behavior of the slide will not be affected by this setting.
Setting Slide(s) as Hidden
Hiding one or more slides is possible using the context menu (see image above). This will mark those slides as hidden in the slides list in the left of the editor, and prevents them from being shown in the presentation and print view. In addition, they will be hidden from users accessing the report who do not have edit permissions for the report.
Report Presentation View
You can start presenting the current report by clicking the Start button. This will open the presentation in fullscreen mode, starting on the first slide.
Alternatively, you can select Start from current slide. Hidden slides will be excluded from the displayed report.
Report Print View
The Report Print View is a view that contains report slides only (without slide preview list). The simplified layout allows to navigate to the Print view of your browser and either print the report directly or save it as a PDF document. Hidden slides are excluded from the displayed report.
Basic Role View
Teamscale's permission management, alongside with corresponding views, is discussed in full detail here.