
Analyzing the Root Causes of Your Defects
Most teams know their defect rate, but few know what actually causes all these bugs. Teamscale combines the defect data from your issue tracker with the change history of your code, so you can see which parts of your system cause most of your defects and which quality metrics those defect hotspots have in common.
This guide walks you through a complete analysis: you first locate your defect hotspots, then find out which quality metrics correlate with them, then work out why the defects slipped through testing, and finally use those insights to activate mitigations that Teamscale enforces.
Plan a few hours for the first run. It pays off to repeat the analysis once per release cycle or quarter, so you can tell whether your mitigations work.
Preparing Your Project
The analysis draws on the available code and issue history from your Teamscale project, so it is worth checking these prerequisites before you start:
- A project with at least one year of code and issue history. Defect density only becomes meaningful once enough bug fixes have accumulated to tell hotspots apart from random noise. See our guide on creating a project if you need to set one up with a longer history.
- A connected issue tracker. Teamscale attributes defects to code through the link between issues and commits, so without a tracker there is no defect data to analyze. See our guide on connecting to issue trackers.
- Commits that reference their issue ID. Teamscale identifies issue-related changes by searching commit messages and branch names for issue IDs. Changes that mention no issue ID cannot be attributed to a defect. It does not matter whether these commits were made on your main branch or on a feature branch, because Teamscale transfers the issue references to the merge target when a branch is merged.
Finally, open the Test Gaps > Unlinked Changes page to see how much of your recent development is not associated with any issue.
Check Your Unlinked Changes First
If a large share of your changes is unlinked, every defect hotspot in this analysis is understated, because the defect fixes in that share are invisible to Teamscale. In that case you are measuring your commit hygiene rather than the distribution of your defects. Improve the issue references in your commit messages before you draw conclusions.
Finding Your Defect Hotspots
The first question is where your defects actually live. Teamscale offers two views on this, and it is worth using both.
Getting a Quick Overview
Open the Issues page in the Activity perspective and enter a query that selects your defects. Which attributes are available depends on your issue tracker, and the query box offers autocompletion to help you find them. A query along the lines of Type = Bug && closed = true is a good starting point, because fixed defects are the ones whose fixes you can trace back into the code.
Click Show trend and treemap to see how the number of matching defects developed over time, together with a treemap of the files that were edited in the course of those defects.
Most Important: Save the Query
Save the query with Save Query. Every widget in the following sections needs a stored issue query to know which issues count as defects.
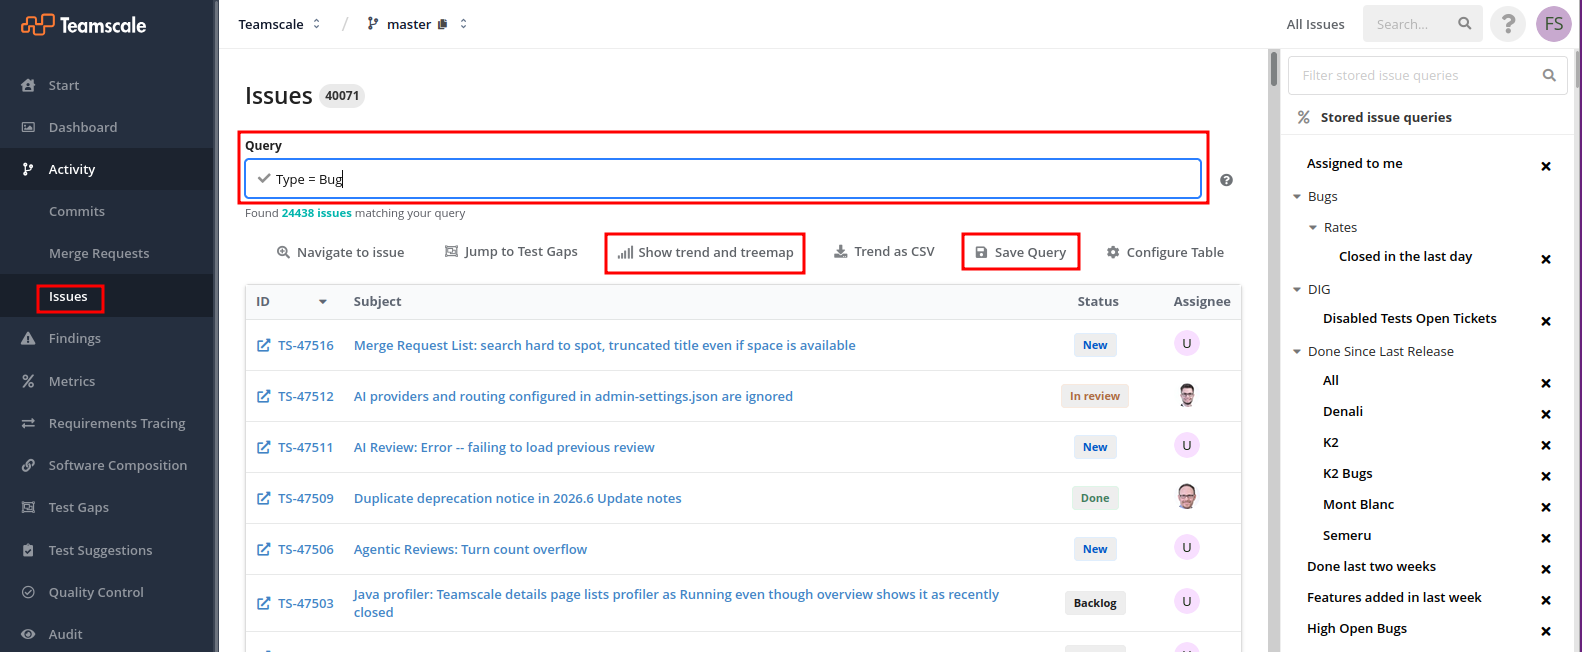 The Issues page in the Activity perspective: enter your defect query in the query box, open the treemap with Show trend and treemap, and store the query with Save Query. Your stored queries are listed in the right sidebar.
Drilling down to Individual Methods
For a more precise picture, add a Method-based Treemap widget to a dashboard. Switch to the Dashboard perspective, add a new dashboard or edit an existing one, and select the widget from the right sidebar. Then click the icon at the widget's upper-left corner and configure it:
- Leave Metric at
Number of Findings. - Enable Filter by issue query and select your saved defect query under Stored Issue Query.
- Set Coloring Option to
Number of Matched Issues. This option is only offered while Filter by issue query is enabled, since it colors each method by how many of the matched issues touched it.
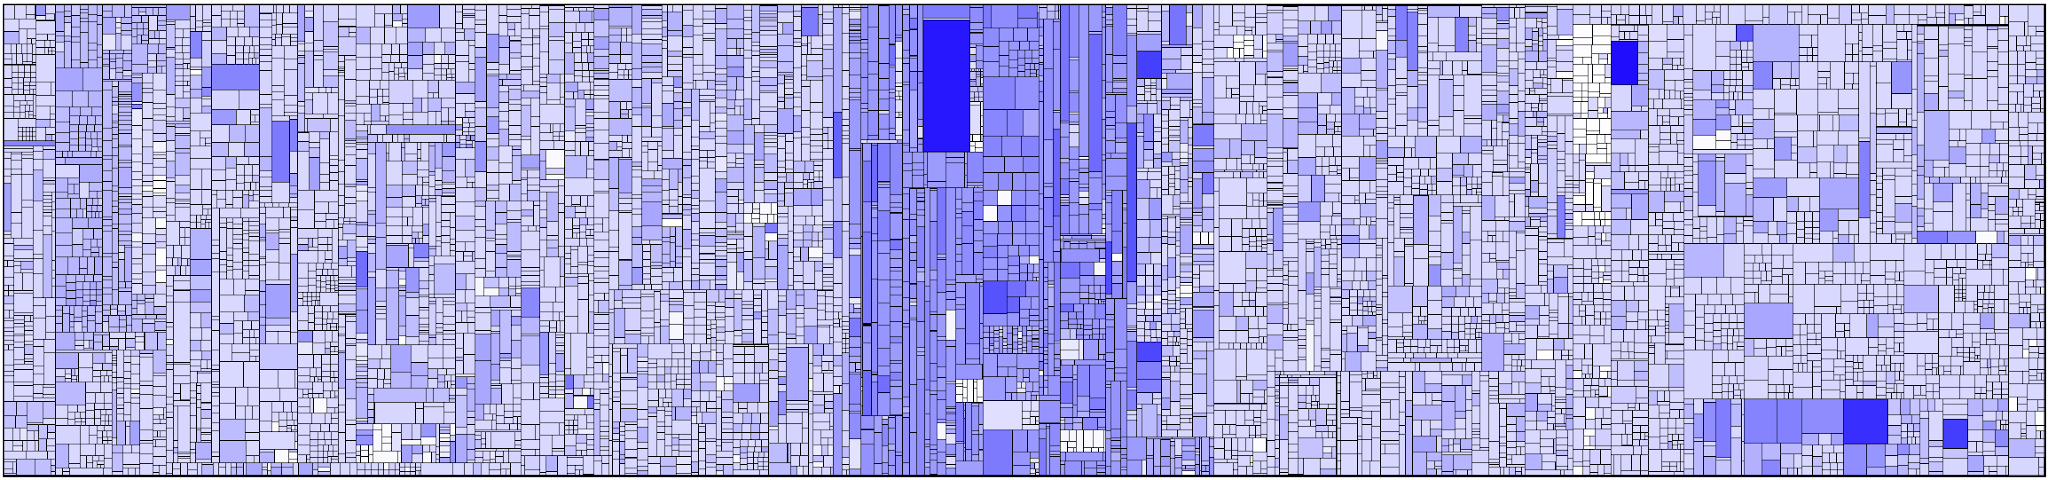 Each rectangle is a method and its area is the method's size. The darker the color, the more defect fixes touched that method. The hotspot in the middle is clearly visible.
The methods that stand out here are the ones to investigate. All options are described in the reference on the Method-based Treemap widget.
Correlating Defect Hotspots with Quality Metrics
Knowing where your defects are is only half the answer. You now want to know what those places have in common, so Teamscale compares a quality metric between the code your defects touched and the rest of your codebase.
Two widgets perform this comparison: the Method-based Treemap widget compares a metric per method, the Issue-based Metric Treemap widget compares it per file. Start with the Method-based Treemap widget for every metric it supports, because measuring per method keeps the result specific enough to act on and lets you jump from a suspicious method straight to the defects that hit it. The file-based widget covers the metrics that have no per-method equivalent, as described in Comparing Metrics That Only Exist per File.
Comparing Findings and Coverage per Method
Click the Duplicate button in the title bar of the Method-based Treemap widget you created earlier, so that the hotspot view stays intact while you reconfigure the copy.
In the copy, keep Filter by issue query enabled with the same stored defect query. Enable Show summary so that the widget's subtitle compares the defect-referenced methods against all methods and gives you the difference as a percentage. Raise Outline depth to 1 or 2 so that package boundaries are drawn: the interesting signal is a whole area lighting up, not an individual dark rectangle, because a single method is far weaker evidence than an entire package.
The Metric option then decides what you compare.
Comparing Test Coverage
This comparison requires test coverage uploaded for your project, since Teamscale can only compare coverage it has received. If it has none, see our guide on uploading external analysis data to set up coverage uploads first, and skip this section until coverage arrives.
Set Metric to Line Coverage and the Coverage Sources to the partitions whose coverage you want to consider. This shows you how well tested your defect-prone code is today.
The Statistics calculation determines what exactly the subtitle compares:
Average-based comparisoncompares the average coverage of both groups. It needs no further configuration, which makes it the best starting point.Method-based comparisonandArea-based comparisoncompare how many methods, or how much code, fall below a coverage you consider sufficient. Both therefore ask you to enter that coverage as a Violation Threshold, as a value between 0 and 1, for example0.8for 80% coverage.
This metric offers no Coloring Option, because the color always shows the coverage of the method.
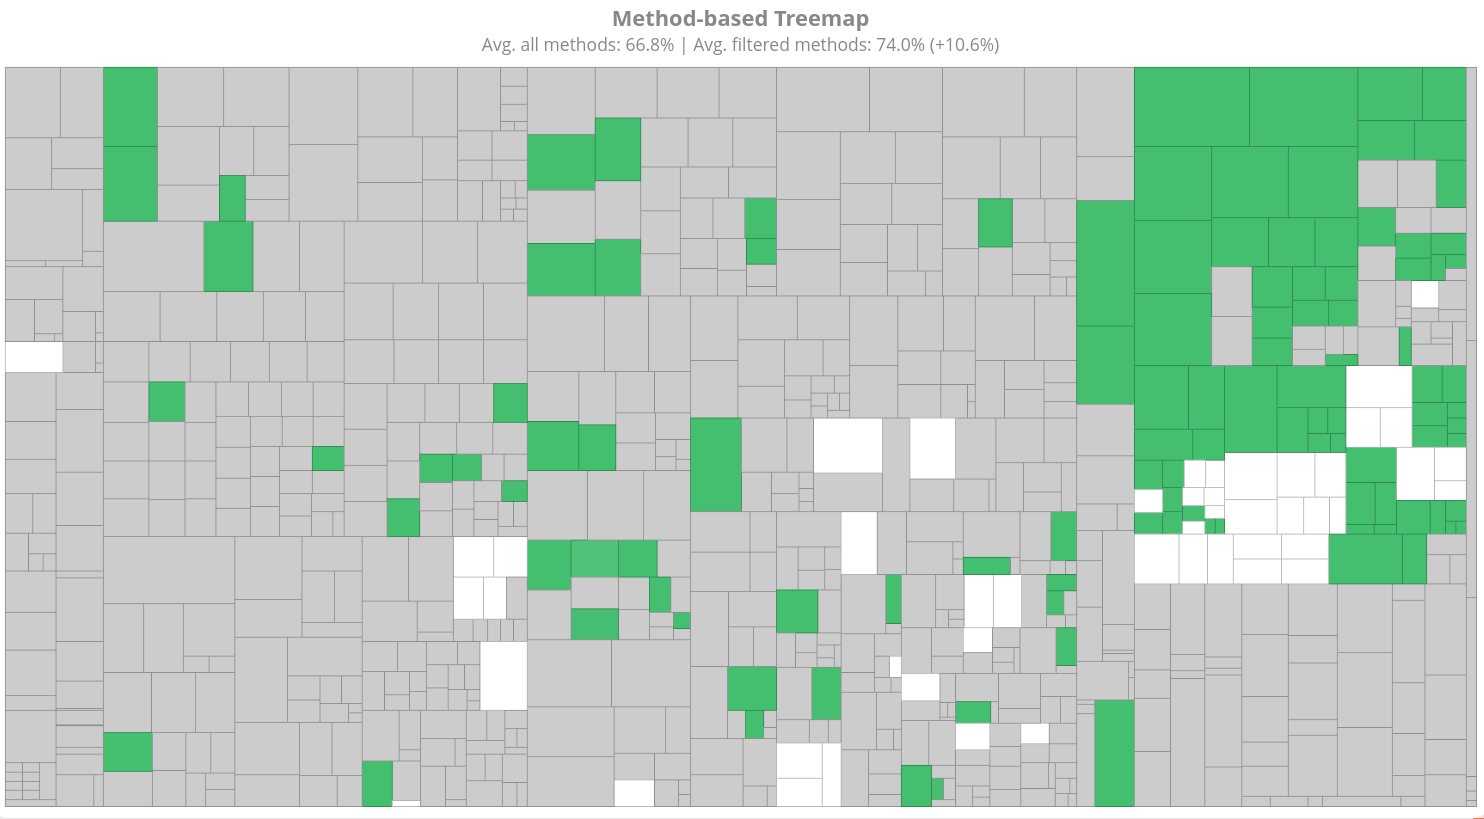 Gray methods were never touched by a defect fix. Among the rest, the greener a method, the better its test coverage, while white methods are not covered at all.
The subtitle is where you read the result. In this example the defect-referenced methods average 74.0% coverage against 66.8% across the whole system, so they are 10.6% better covered than average and still produced the defects. That is a common outcome rather than a contradiction: teams test the code they already consider risky more thoroughly, so the code is executed by tests without those tests verifying the behavior that later broke. The consequence is that you have to look at what your tests assert, not at how much they cover.
Comparing Findings
Set Metric to Number of Findings to compare how many static analysis findings the two groups carry.
Switch Coloring Option away from Number of Matched Issues to Number of Findings or Findings Severity in order to show how many findings each method contains via the color.
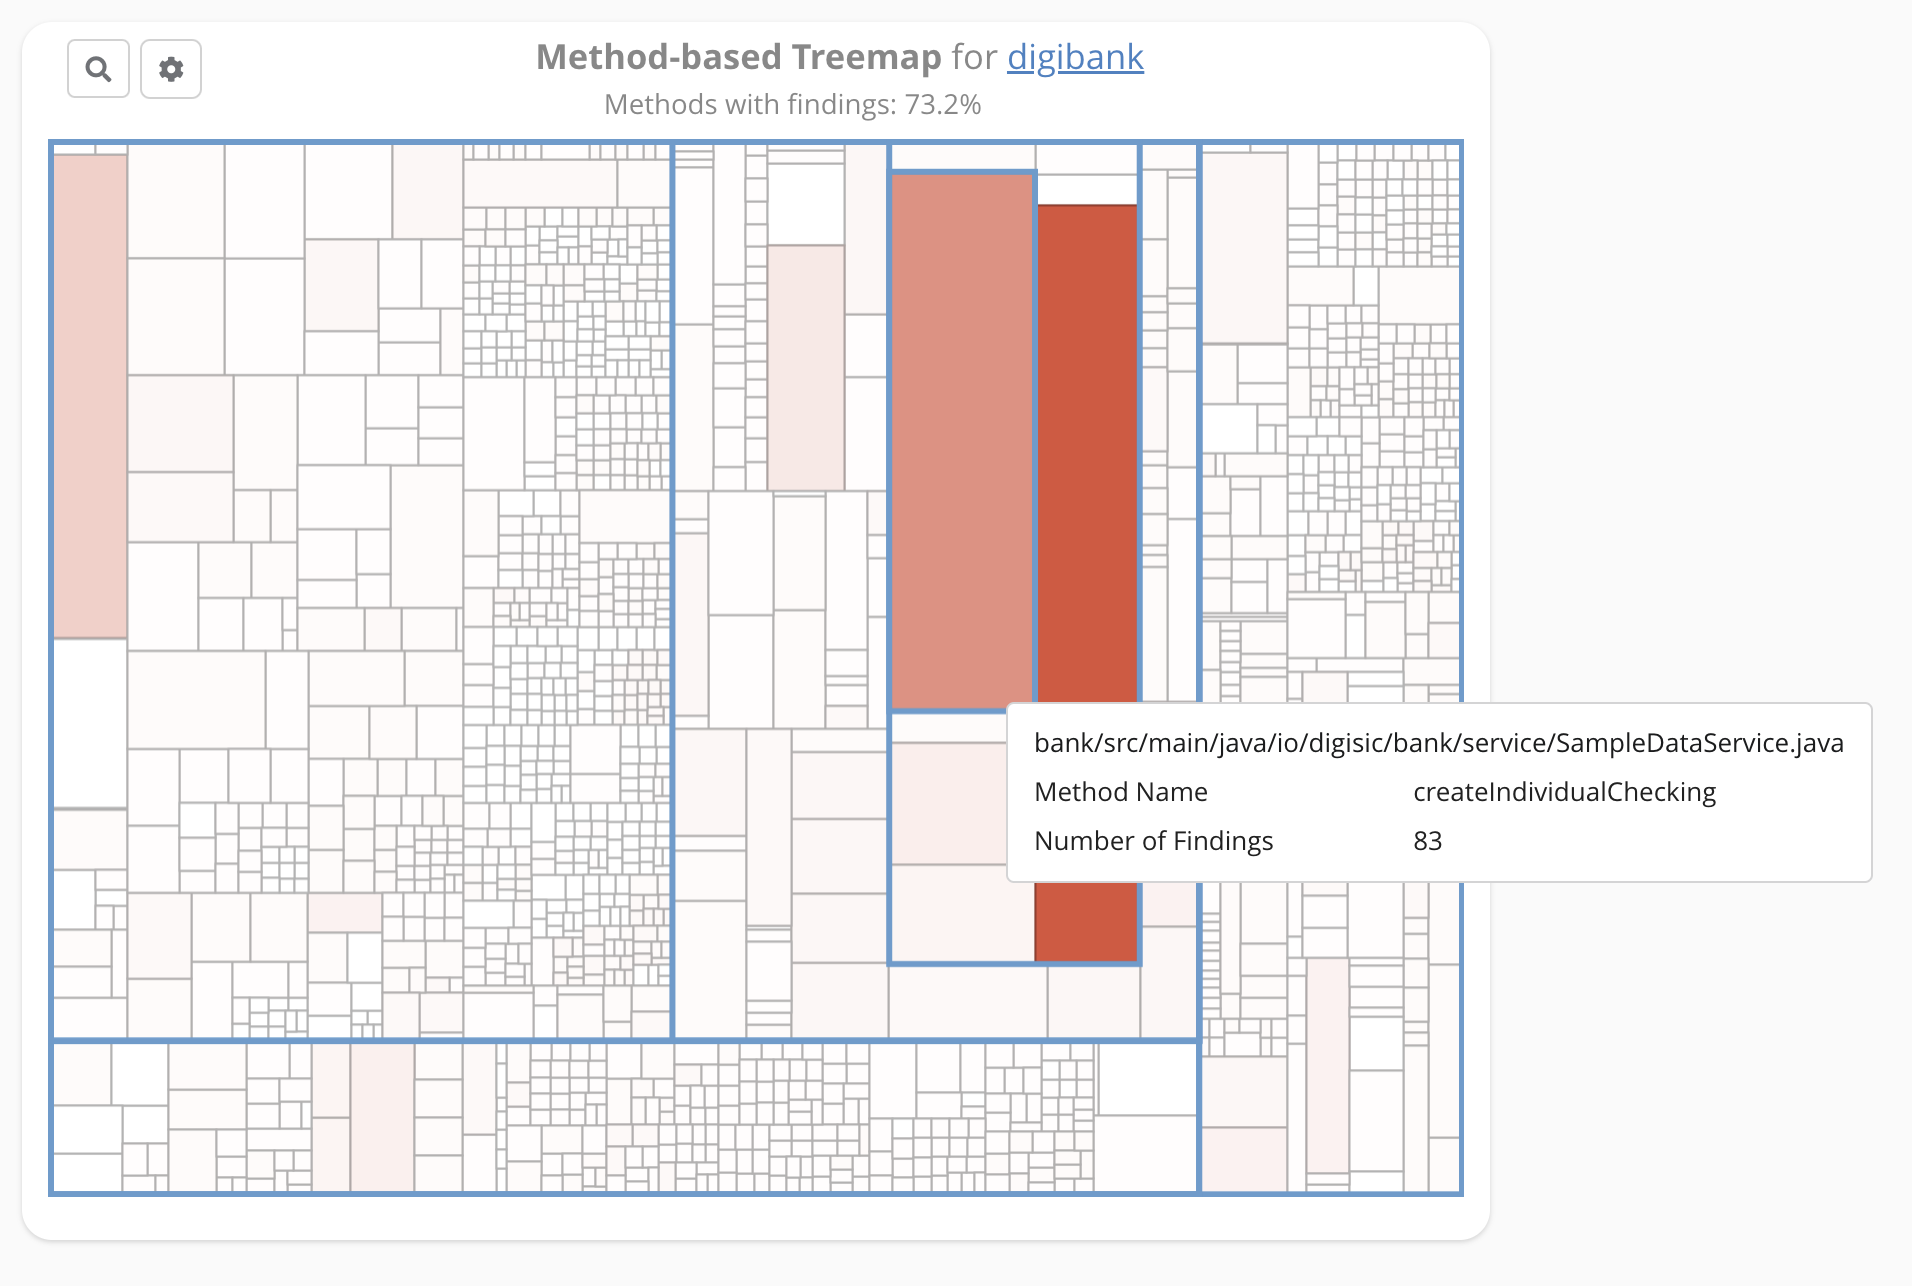 Color intensity shows the number of findings per method, and the outlines separate packages. This example was configured without a defect query, so every method is colored and the subtitle only reports the value over all methods.
Rather than comparing all findings at once, use Findings Filters to narrow the measurement to a single finding category or group. This separates causes that have nothing to do with each other. These groups are worth trying, because each of them plausibly relates to defects:
Structure, containingNesting Depth,Method Length,File SizeandExcessive Parameters, because all of them make a method harder to test.Code Duplication, containingCode Clones, because a fix may have been applied to one copy of the code but not to the others.Correctness, containingPossible Bugs,Error-prone Practices,API MisuseandConcurrency.Error Handling, containingImprecise Handling, because a swallowed error hides a failure until it reaches production.Security.
Clicking a method opens a popup with View Method, its history, and View N referenced issues for that method. That last link opens exactly the defects that touched the method.
Work through the coverage and findings comparisons one at a time and note how large the difference is for each. The ones with the largest differences are your candidates for the next step.
All options are described in the reference on the Method-based Treemap widget.
Comparing Metrics That Only Exist per File
A few metrics are not available per method but only per file. For those, use the Issue-based Metric Treemap widget, which performs the same comparison per file. Test coverage as well as duplication and structure findings are covered more precisely by the Method-based Treemap widget, so use the file-based widget for the assessment metrics and for how often the code changes.
Add the Issue-based Metric Treemap widget to a dashboard the same way as before and configure it:
- Stored Issue Query selects the issues that count as defects, again your saved defect query.
- Color Metric is the quality metric you want to correlate with the defects.
- Area Metric determines the size of each rectangle.
Lines of Codeis a sensible default. - Exclude non-referenced files hides all files that no defect ever touched, which is useful once you want to focus on the hotspots alone.
- Show summary adds the comparison to the widget subtitle, and Summary type determines how it is calculated. This is the option that turns a picture into a measurement, so leave it enabled.
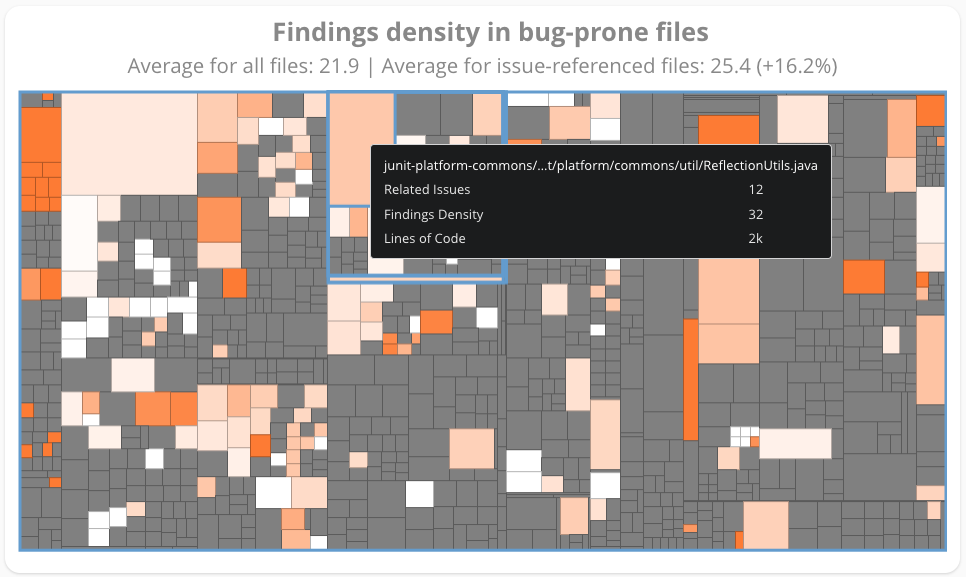 Files with a shading between white and orange were touched by a defect fix, gray files were not. The darker the orange, the higher the findings density in that file. The subtitle compares the metric across both groups.
In the example above, the average findings density across all files is 21.9, while across the defect-referenced files it is 25.4, or 16.2% higher. That difference is the actual result of the analysis: it says that static analysis findings and defects tend to occur in the same places in this system.
These are the metrics worth trying here:
Change Count— how often the code changes. Frequently changed code is the classic predictor of defects.Cyclomatic Complexity Assessment— how convoluted the control flow is, and therefore how hard the code is to test.Findings Density— the number of findings relative to the size of each file, rather than the absolute count per method.- All assessment metrics like
File Size AssessmentorMethod Length Assessmentto identify hotspots of complex, hard-to-test code.
All options are described in the reference on the Issue-based Metric Treemap widget.
What Other Teams Find
Three results come up often enough to be worth anticipating:
- Defect-prone methods frequently have higher test coverage than the codebase average, for the reason described above. Review what those tests assert instead of raising coverage further.
- Defects correlate with
Change Count. This is well known, but seeing it confirmed on your own system makes the case for prioritizing frequently changed code in quality assurance activities, for example with Test Gap analysis. - Defects correlate with badly structured code. For example, long methods and files, deeply nested code, or high cyclomatic complexity. The reason is simple: complex code is hard to test. Prioritize reducing the complexity, splitting up complex code into testable units and improving the overall testability of this code.
Understanding Why the Defects Slipped Through
These visualizations and metrics surface correlations between defect-proneness of code and quality metrics, like its complexity. A correlation tells you where to look, not why the defects happen. To find that out, you have to read individual defects.
Pick a handful of defects from the areas where you found the strongest correlation, for example defect-prone code with high nesting depth. For each of them, open the Issue Details view, which shows the code that was changed to fix the defect along with a Test Gap treemap for those changes. Pressing the hotkey I anywhere in Teamscale and entering the issue ID is the quickest way there.
Then ask, for each defect:
- Was the code that broke covered by tests before the fix?
- If it was covered, did the tests exercise the control flow path that actually failed?
- Did the right test stage find the defect, for example was it found in the User Acceptance Test when unit tests should have caught it?
- Did the metric you identified plausibly contribute to the bug, for example because the method was too deeply nested to test its branches individually?
Write down what you find as a short list of hypotheses and validate each one with the developers who own the code.
Deriving and Enforcing Mitigations
Each validated hypothesis should lead to a concrete change in how you work. Teamscale can enforce most of these mitigations directly in your merge requests, which is what makes them stick after this one-time analysis is over. See our guide on getting feedback in pull and merge requests for what these integrations can show, and the vote-supporting connector options for how to enable each of them.
These are the mitigations that address the hypotheses we see most often:
- Untested changes keep reaching production. Make Test Gaps part of your regular workflow, so untested changes are caught before release rather than after. See our guides on analyzing issue Test Gaps and working with Test Gap treemaps. Activate the project options Enable Test Gap Integration for Merge Requests together with Enable Test Gap Badges in your connector, so every merge request states its Test Gaps before it is merged.
- The code is too hard to test. Activate Enable Findings Integration together with Enable Findings Badge and Enable Detailed Line Comments For Findings, so that the structure and complexity findings in the changed code are commented directly in the merge request's diff view. In addition, add a metric badge for the relevant structure and complexity metrics, so developers see how their change moves them. See our guide on tracking metrics in merge requests.
- Fixes miss cloned copies of the code. Activate Enable Commit Alerts for Merge Requests so that clone alerts are commented on the merge request whenever a change is applied to one copy of a clone but not to the others.
- Developers do not know they are touching risky code. Bring the information to where they work, in their code review and in their IDE. See our guide on getting personalized feedback and the list of supported IDEs. On top of that, configure a critical change badge whose patterns match your hotspots, so that every merge request touching them is marked automatically. See our guide on tracking critical changes in merge requests.
Confirming the Mitigations Work
A one-time analysis produces insight, but only continuous feedback changes behavior. Two things tell you whether your mitigations are having an effect:
- Watch the long-term trend of the metric that correlated, to confirm the mitigation actually moves it. See our guide on monitoring quality evolution.
- Repeat this analysis each release cycle and report the results, so your team can see whether the defect hotspots are shrinking. See our guide on creating a quality report.
Getting Help
If you would like support running this analysis on your own system, contact us!