How to Edit an Analysis Profile
You can begin editing an analysis profile from two locations in Teamscale:
- by clicking the button in the Analysis Profiles View
- by clicking the Edit-button when viewing an analysis profile in the Check Explorer
By default, an extension of the Check Explorer is used to edit an analysis profile.
WARNING
The changes made in the Check Explorer only take effect after saving the analysis profile. They do not affect existing projects using the profile, unless you select them for reanalysis when saving the analysis profile.
Editing General Options of the Analysis Profile
First of all, you can edit the analysis profile's description by clicking on Description at the top of the Check Explorer.
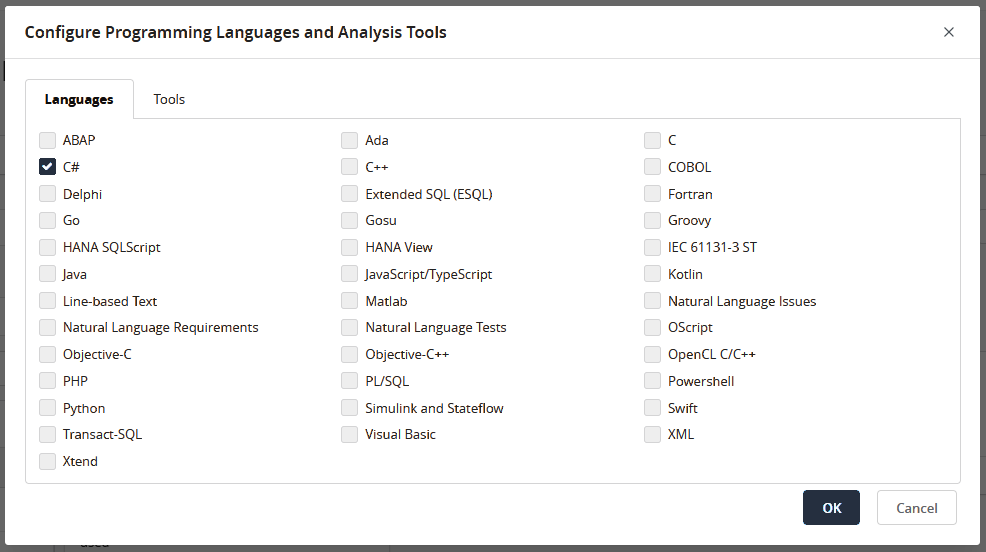
In order to change the currently analyzed programming languages and additional analysis tools, you can click Language & Tool Enablement in Analysis Profile Settings below the profile's description. Each of the languages and tools comes with their own preconfigured analysis groups and checks, which are set to their default severity when adding a new language/tool.
Next to the Language & Tool Enablement you can click Advanced options to inspect and edit more options for the analysis profile.
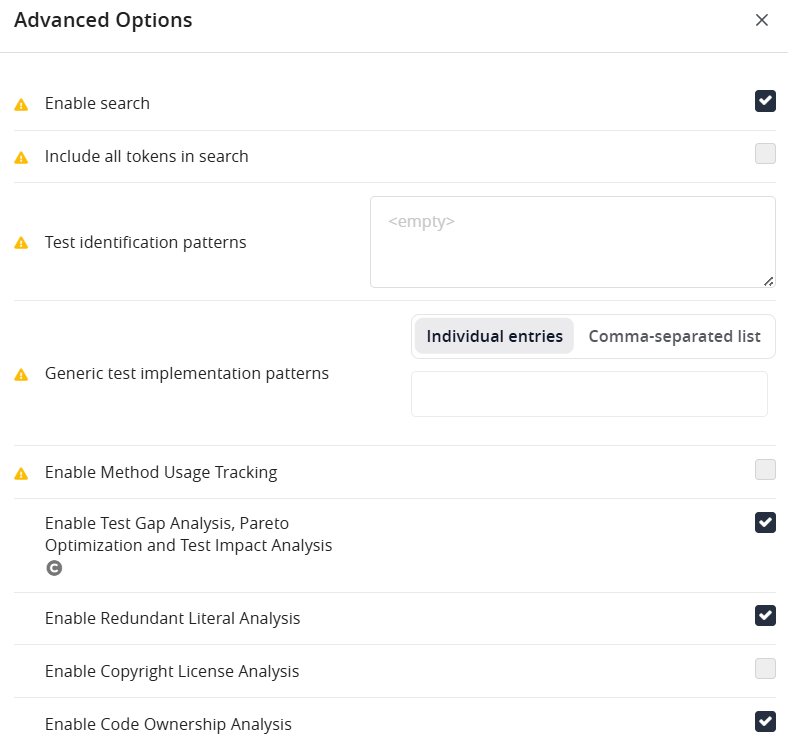
These global options do not affect a single quality indicator but rather the entire analyzed project, e.g. whether to enable searching.
| Disable clone-based move tracking | Tick to disable tracking of moving or renaming files |
| Enable search | Should Teamscale enable users to search in the project source code, commits, and issues? |
| Enable Redundant Literal Analysis | Enables the analysis of redundant literals in the source code. If enabled, Teamscale generates findings for often-occurring string literals. |
| Test identification patterns | This enables to analyze tests implemented in a custom test framework, where the test entities can be detected via regular expressions in the code. A list of mappings from test properties to regular expressions should be provided. There must be at least one mapping for the test's name i.e. `Name -> @test: ID-(.*)`. The regular expressions are matched against the raw content of the file. The nearest function to the matched name is picked as the corresponding code entity. The left side of the mappings specifies the name of a test's property. The first capture group in the regular expression should match the value of the corresponding field. Make sure to escape reserved characters like '(', ')' or '.' as well as commas properly with the escape character '\'. Lines starting with '##' are ignored. |
| Generic test implementation patterns | This defines whole files as test implementations for test frameworks that Teamscale does not support. Provide a list of Ant patterns matched against file paths (for example **/*.robot). Each matching file becomes a single test implementation whose path is the test name and whose file content is the implementation body. The patterns are matched case-sensitively. Matching files must be part of the analyzed code (not excluded from the project), otherwise they will not be found. See Generic File-Based Test Implementations for details. |
| Predefined Preprocessor Macros (C/C++/Objective-C/Objective-C++ projects only) | Here you can specify macros which are not defined in the project source code. If those macros are not defined, Teamscale might issue warnings about undefined macros. |
| Target Triple (C/C++/Objective-C/Objective-C++ projects only) | This is the target triple argument that typically contains information about the target architecture and operating system, that can be helpful for parsing purposes. This should be in the canonical form defined by LLVM as architecture-vendor-os (most common), or architecture-vendor-os-environment or architecture-vendor-os-environment-format (least common). For example, values for the target triple field can be arm64-apple-ios, x86-pc-win32, or x86_64-unknown-linux-gnu. Teamscale might issue errors if input is not in a valid format. More information about the LLVM target triple argument can be found here. |
Editing Quality Indicators and Analysis Groups
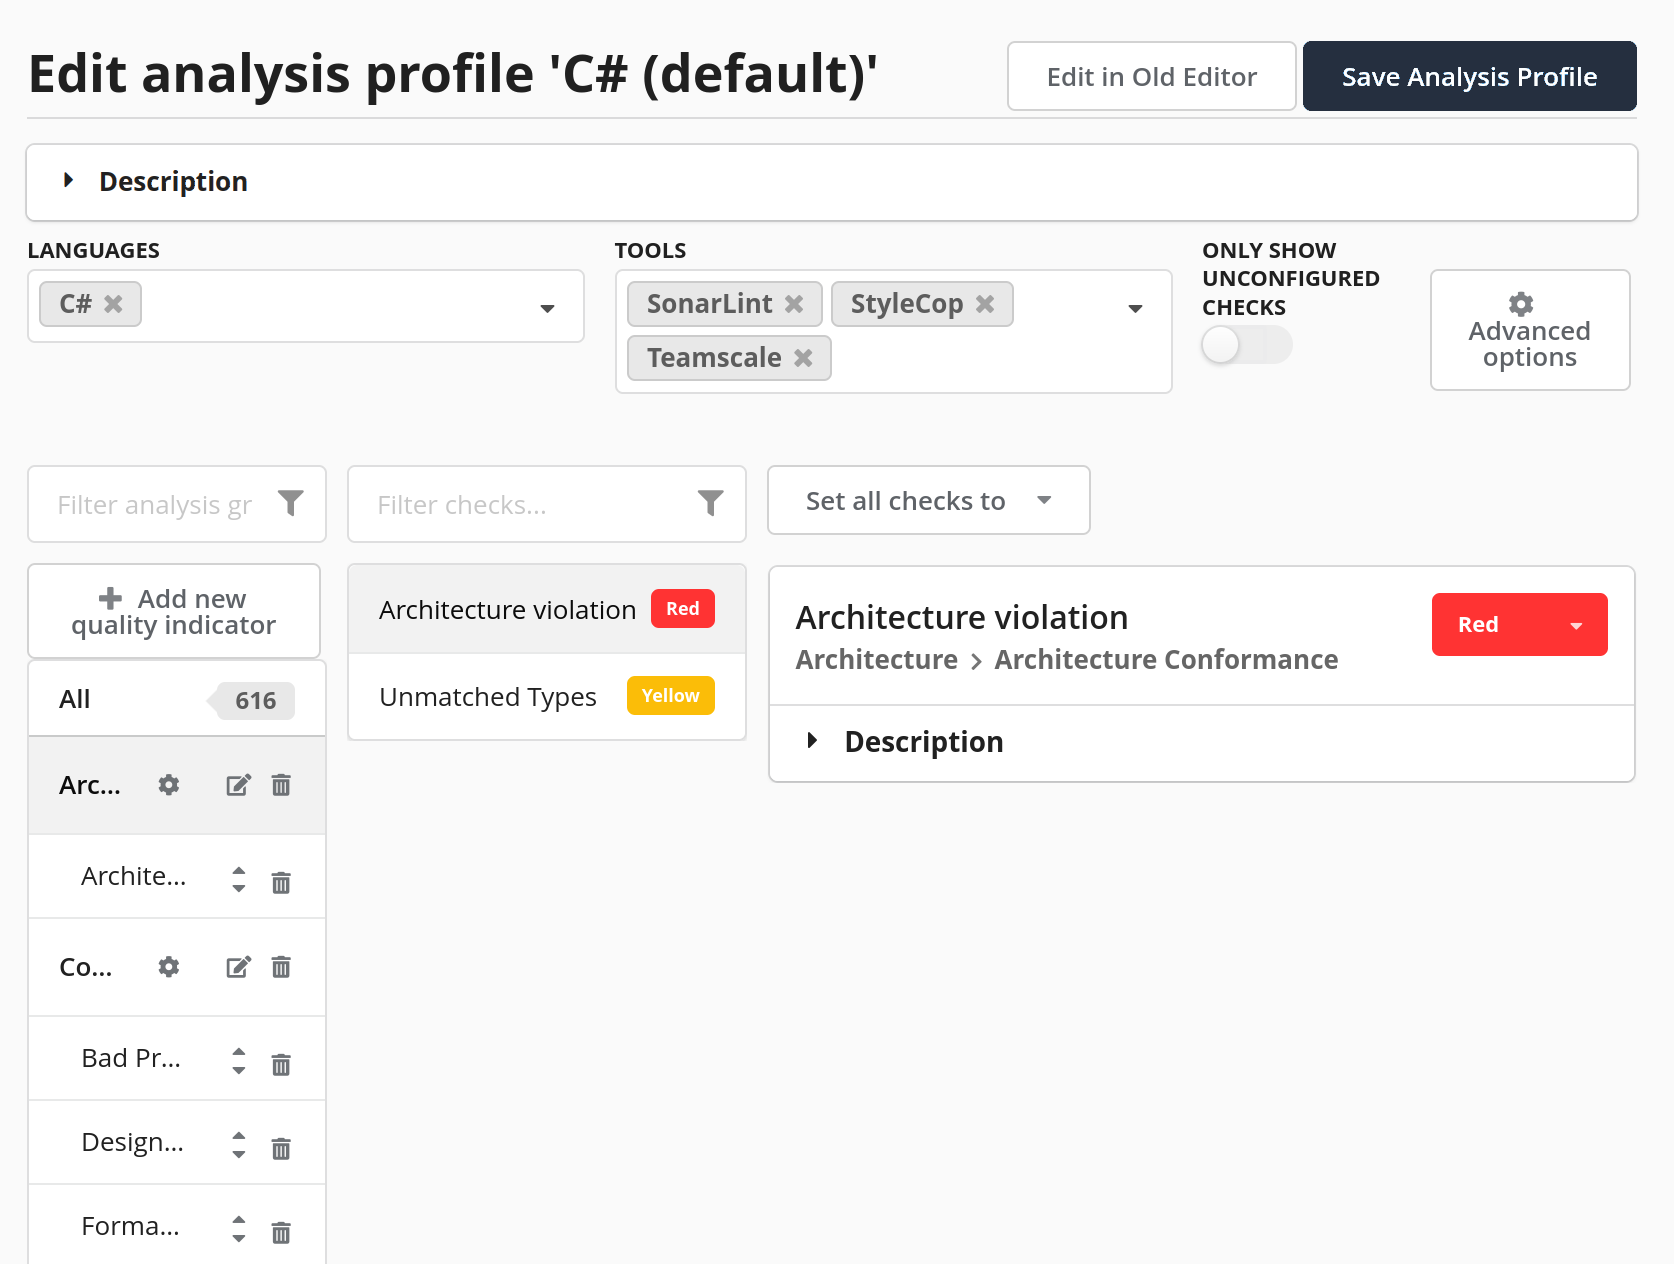
After selecting languages and tools to work with, you can adjust the check configuration to your needs, including quality indicators and analysis groups.
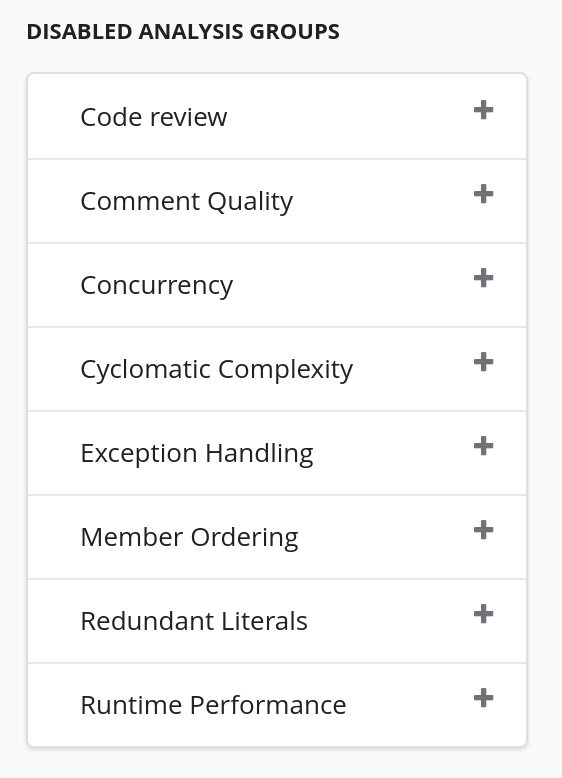
Similar to the Check Explorer, the list on the left side contains the profile's quality indicators and their analysis groups, while the right one contains the checks for the currently selected indicator/group. Additionally, there is a list of analysis groups at the bottom of the view, which are available to your languages and tools, but disabled in the current configuration.
You have multiple options to edit the current configuration:
Add a new quality indicator.
In order to add a new quality indicator you have to click Add new quality indicator, which opens a new dialog where you have to enter a valid name (not only whitespace, no duplicate name) and confirm.
Delete a quality indicator.
In order to delete a quality indicator you have to click its button and confirm the dialog.
WARNING
If you delete a quality indicator, all of its analysis groups will be disabled.
Rename a quality indicator.
In order to rename a quality indicator, click its button and enter a valid name into the dialog that opens.
Enable a disabled analysis group.
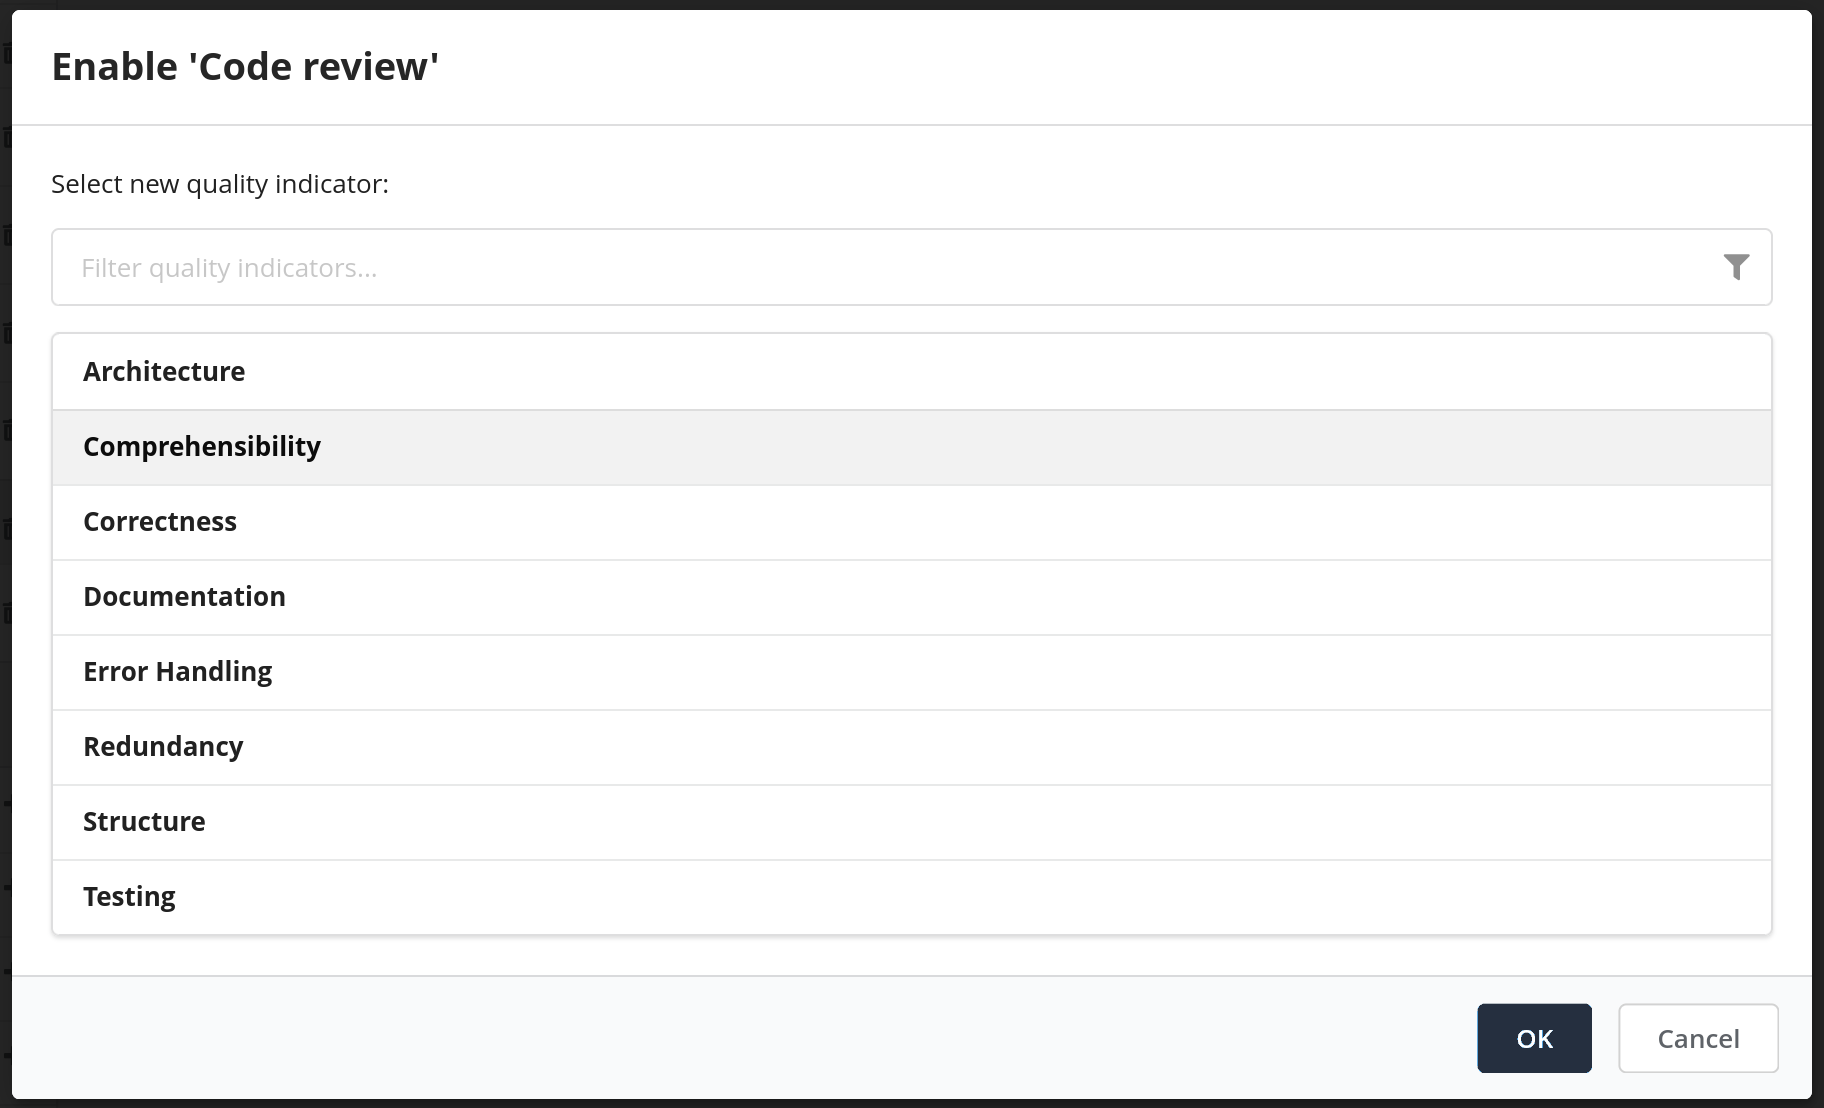
In order to enable a currently disabled analysis group you have to click its button and, in the upcoming dialog, select the quality indicator to put it into.
WARNING
If you enable a disabled analysis group you disabled in the same editing session, its checks will be enabled with their previous severity.
If you enable a disabled analysis group that was disabled before you began editing, its checks will be enabled with their default severity.
Disable an enabled analysis group.
In order to disable an enabled analysis group, click its button.
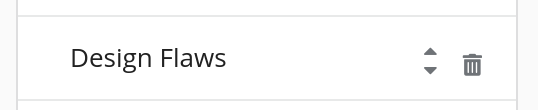
Move an enabled analysis group between different quality indicators.
Since quality indicators can be used to group related analysis groups, you can move an enabled analysis group between them. For this purpose you have to click the button next to its button.
A dialog similar to the one above is opened, where you can select the quality indicator to move it to.
Adjust indicator- or group-specific options.
Some quality indicators and analysis groups have a number of additional options, which is indicated by the presence of an button in the respective item in the list. In order to inspect and edit them you have to click it.
Editing Checks
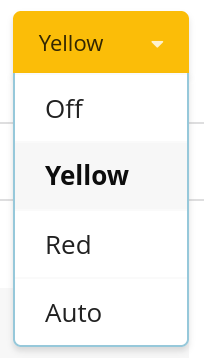
You might want to enable or disable one or more multiple specific checks that are part of an enabled analysis group. For this purpose you have to select it in the list of checks next to the list of quality indicators and analysis groups. As a result the selected check, its description and its options, if it has any, are shown on the right side of the view and can be edited there. In the top right corner of the check description is its severity, which you change to a different value by clicking it and choosing the preferred option in the dropdown.
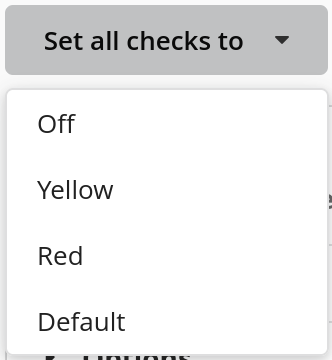
For larger operations, for example changing the severity values of all checks in a certain quality indicator, you can click the Set all checks to dropdown and select your preferred value. As a result, the severity of all currently visible/selected checks is changed. This dropdown also allows you to set a check's severity to its default value.
Finally, you can save your changes to the analysis profile by clicking Save Analysis Profile. If there are any projects using the analysis profile, you will be prompted with a dialog to select the ones you want to reanalyze. Any changes you made in the analysis profile will not affect the ones you did not select.
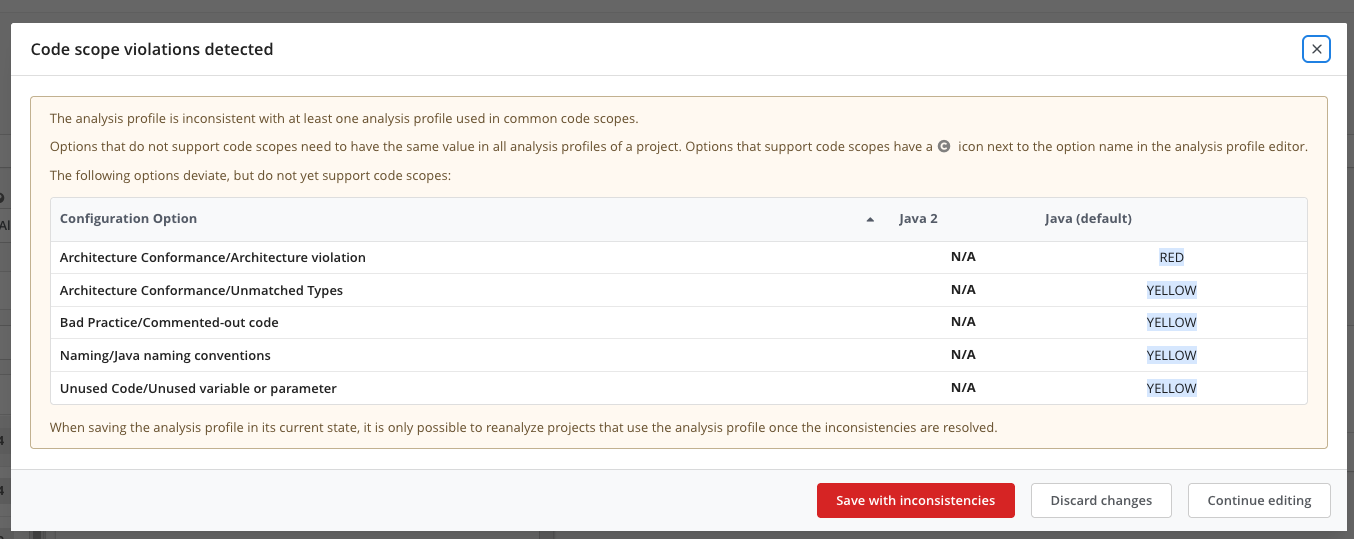
Code Scopes Support
Teamscale's Code Scopes Support allows to apply different analysis profiles to different parts of a project's code base. For some settings, choosing different settings is either not possible or not yet supported. Settings that are Code Scope-aware are indicated as such with a (C) icon in the Check Explorer. If an analysis profile sets an option that is not Code Scope-aware to a different value than another analysis profile referenced by the same project, an informative warning will be shown hinting at the inconsistency. If such an inconsistency occurs, it has to be resolved before the project can be re-analyzed. A common strategy to resolve inconsistencies is to set the respective option to the same value in all referenced analysis profiles.