Delta Perspective
The main purpose of the Delta perspective is to calculate a delta, i. e. compare two snapshots of a system with each other. A snapshot is defined by a point in time and a branch for which Teamscale retrieves the corresponding commit in the version control system as well as all related quality data. The comparison of two snapshots reveals the differences in terms of code changes, metric changes and findings churn as well as information on whether the code changes have been tested.
Types of Delta Computations
Teamscale can compute two types of delta:
- a commit-range delta (i.e., »what happened between commit1 and commit2«), and
- merge-request delta (»what would happen if I merge commit1 on top of commit2«).
The commit-range delta requires two commits as input. These commits should be in a linear commit history (the baseline/start commit should be an ancestor of the end commit). The input for a commit-range delta can be configured in the Linear History tab of the Delta Parameters Page.
The merge-request delta also requires two commits as input. They can be configured in the Merge Request tab of the Delta Parameters Page. You can choose any two different commits from the project repository. Teamscale will compute a preview of the estimated effects that accepting the corresponding merge request would have on the repository (which findings would be added to the target branch, which commits would be merged, etc.).
Since the configuration options and available views for the two types of deltas are similar, we focus on describing the commit-range delta.
Action: Calculate Delta
To calculate a delta, you can navigate to the Delta perspective which will open up the Delta Parameters Page.
Delta Parameters Page
On this page you can configure the delta you would like to calculate:
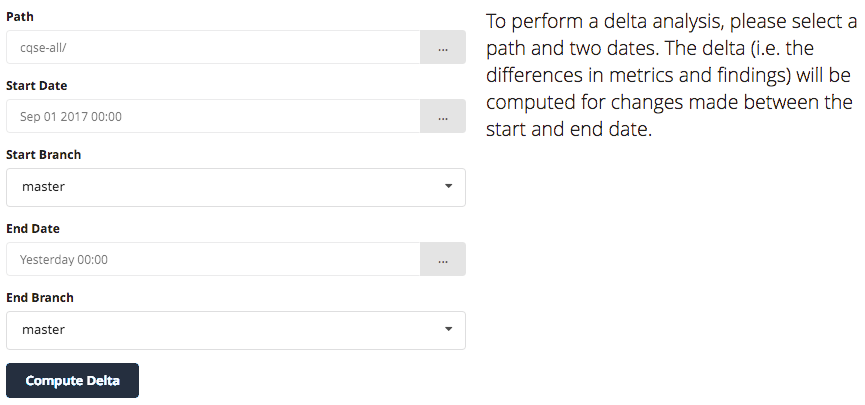
The table below describes the available options. If branch support has been enabled for the underlying project, you can also compare snapshots from two different branches with each other. Click Compute Delta to start the delta analysis.
| Path | Select the path for which you want to compute the delta. This can be a a top-level code folder or any subfolder of a Teamscale project but also a component of an architecture definition. |
| Start Date | Select the start date as a time, revision or baseline. |
| Start Branch | If branch support is activated, you can select the branch for the start date. |
| End Date | Select the end date as a time, revision or baseline. |
| End Branch | If branch support is activated, you can select the branch for the end date. |
Action: Inspect Changed Files
After calculating the delta, the sidebar of the perspective will appear:
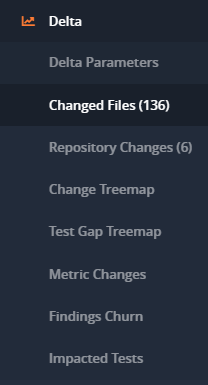
It automatically redirects you to the Changed Files Page. This page gives you an overview which files in the repository were »affected« within the selected interval of the delta:
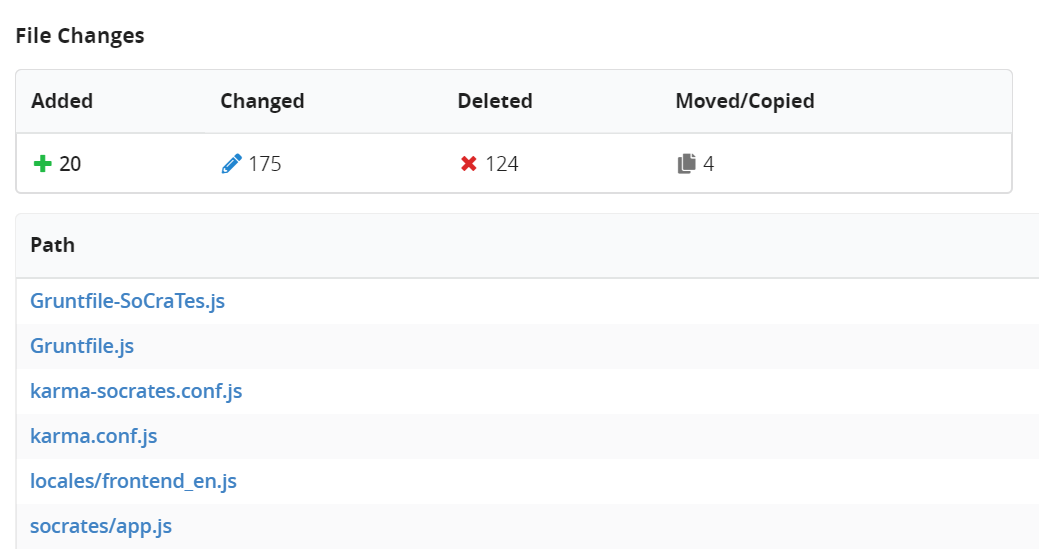
The page provides you a Code Churn Summary indicating how many files were added, changed, deleted or moved/copied. The latter is identified with Teamscale's own origin analysis [1] which reveals if a file was copied from an existing file (either identically or with small changes) or moved between locations. Further more, the page shows you all Affected Paths . If you click on a path, it will redirect you to the Code File View.
If a file has been changed, indicated by the Change type, you can click on it to open the Code Comparison View to examine the differences.
Action: Inspecting Repository Changes
The sidebar provides a link to the Repository Change Page.
This pages provides an overview of all commits which took place within the time interval of the delta. The page contains the activity stream of commits in the same way as the Activity View of the Activity perspective. Browsing the stream of commits is particularly useful if you want to find the root cause of a metric change as described here.
Change Treemap Page
While the Changed Files Page shows the code changes in the delta in a list format, the Change Treemap Page provides the same information in treemap form:
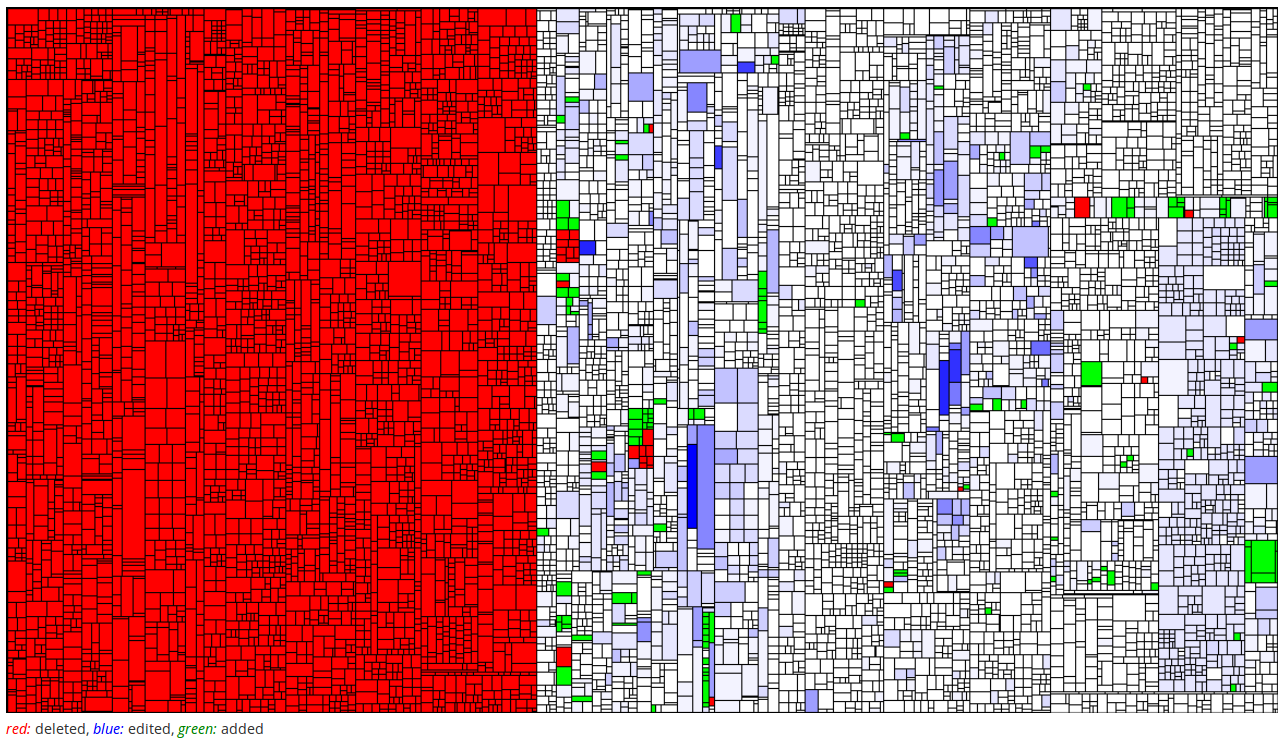
The image shows such change treemap. Red indicates files which were deleted during the delta, blue indicates changed files and green indicates added files.
Action: Viewing the Test Gap Treemap
To get an overview over which changes contained in the delta have been tested and which might have been missed, you can use the Test Gap Treemap Page.
Test Gap Treemap Page
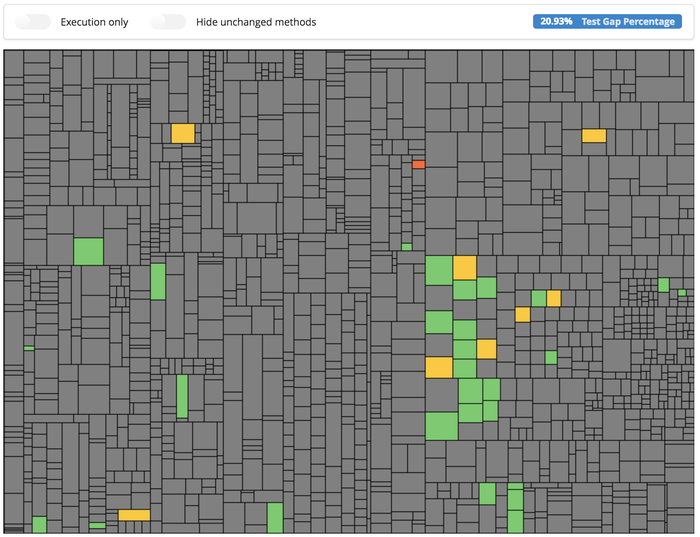
The image shows a test gap treemap for a given delta. This treemap works just like the Test Gap Treemap Widget in the dashboard. It is already configured with the start and end date provided in the delta parameters. Every rectangle represents a method in the system. Gray indicates methods which were not changed in the selected time frame, green indicates added or changed methods which have been tested (and the test coverage has been uploaded to Teamscale), and red and orange indicate untested methods that have been added or changed within the selected time frame, respectively. Also just like in the dashboard, the Execution only toggle shows test coverage irrespective of changes, and Hide unchanged methods makes small changes in large systems easier to locate by hiding all gray areas.
Action: Viewing Metric Changes
The Delta perspective does not only provide information about code churn and the corresponding commits, it also contains the delta with respect to quality data. In particular, it provides the Metric Churn . Use the left sidebar to navigate to the corresponding page.
Metric Churn Page
This page shows the delta for each metric, comparing the metric value at the end of the selected time interval with the metric value at the selected baseline.
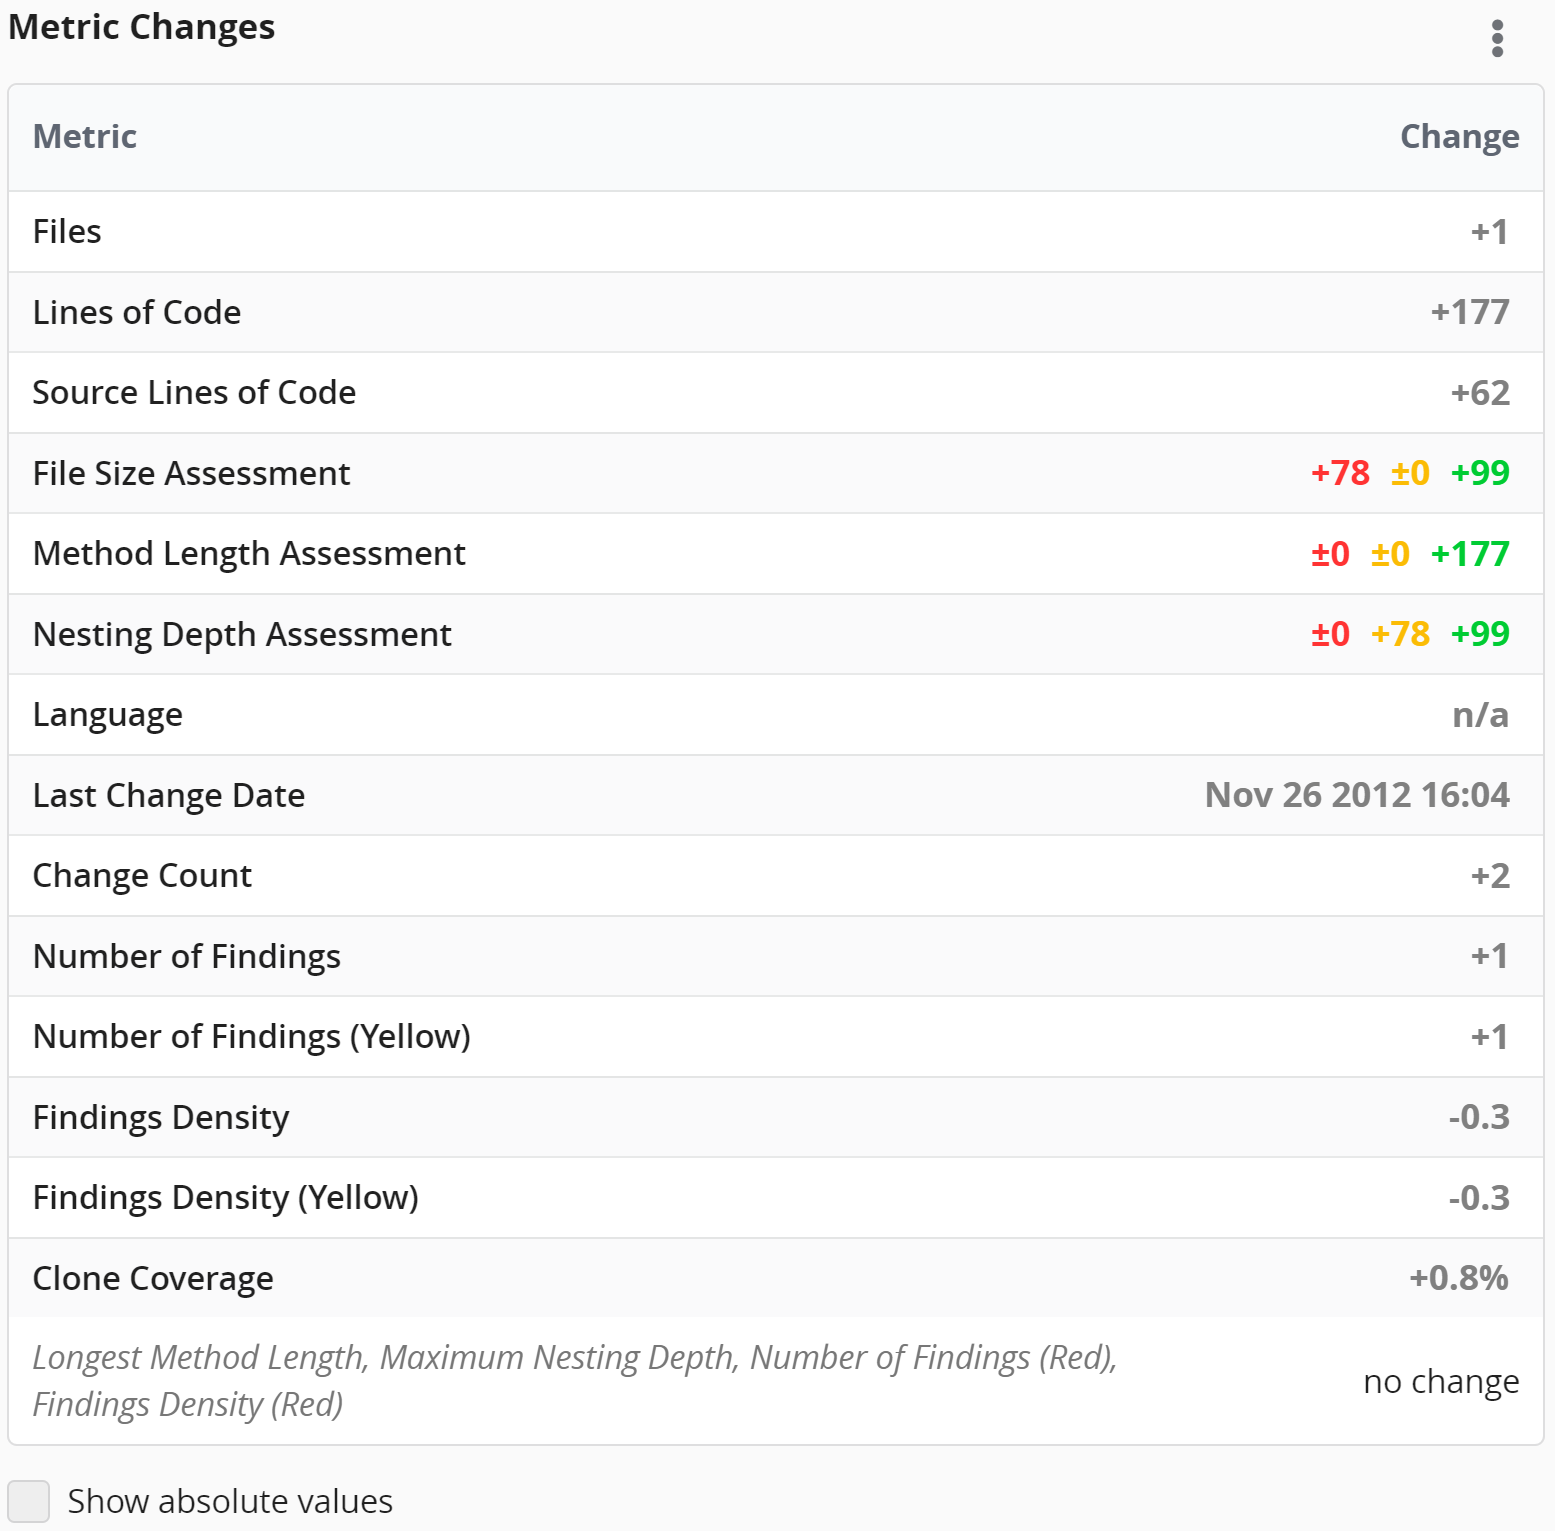
The image shows the table indicating the Metric Churn . For each metric, it provides the name as well as the delta change. If the checkbox at the bottom is checked it also displays the absolute metric value.
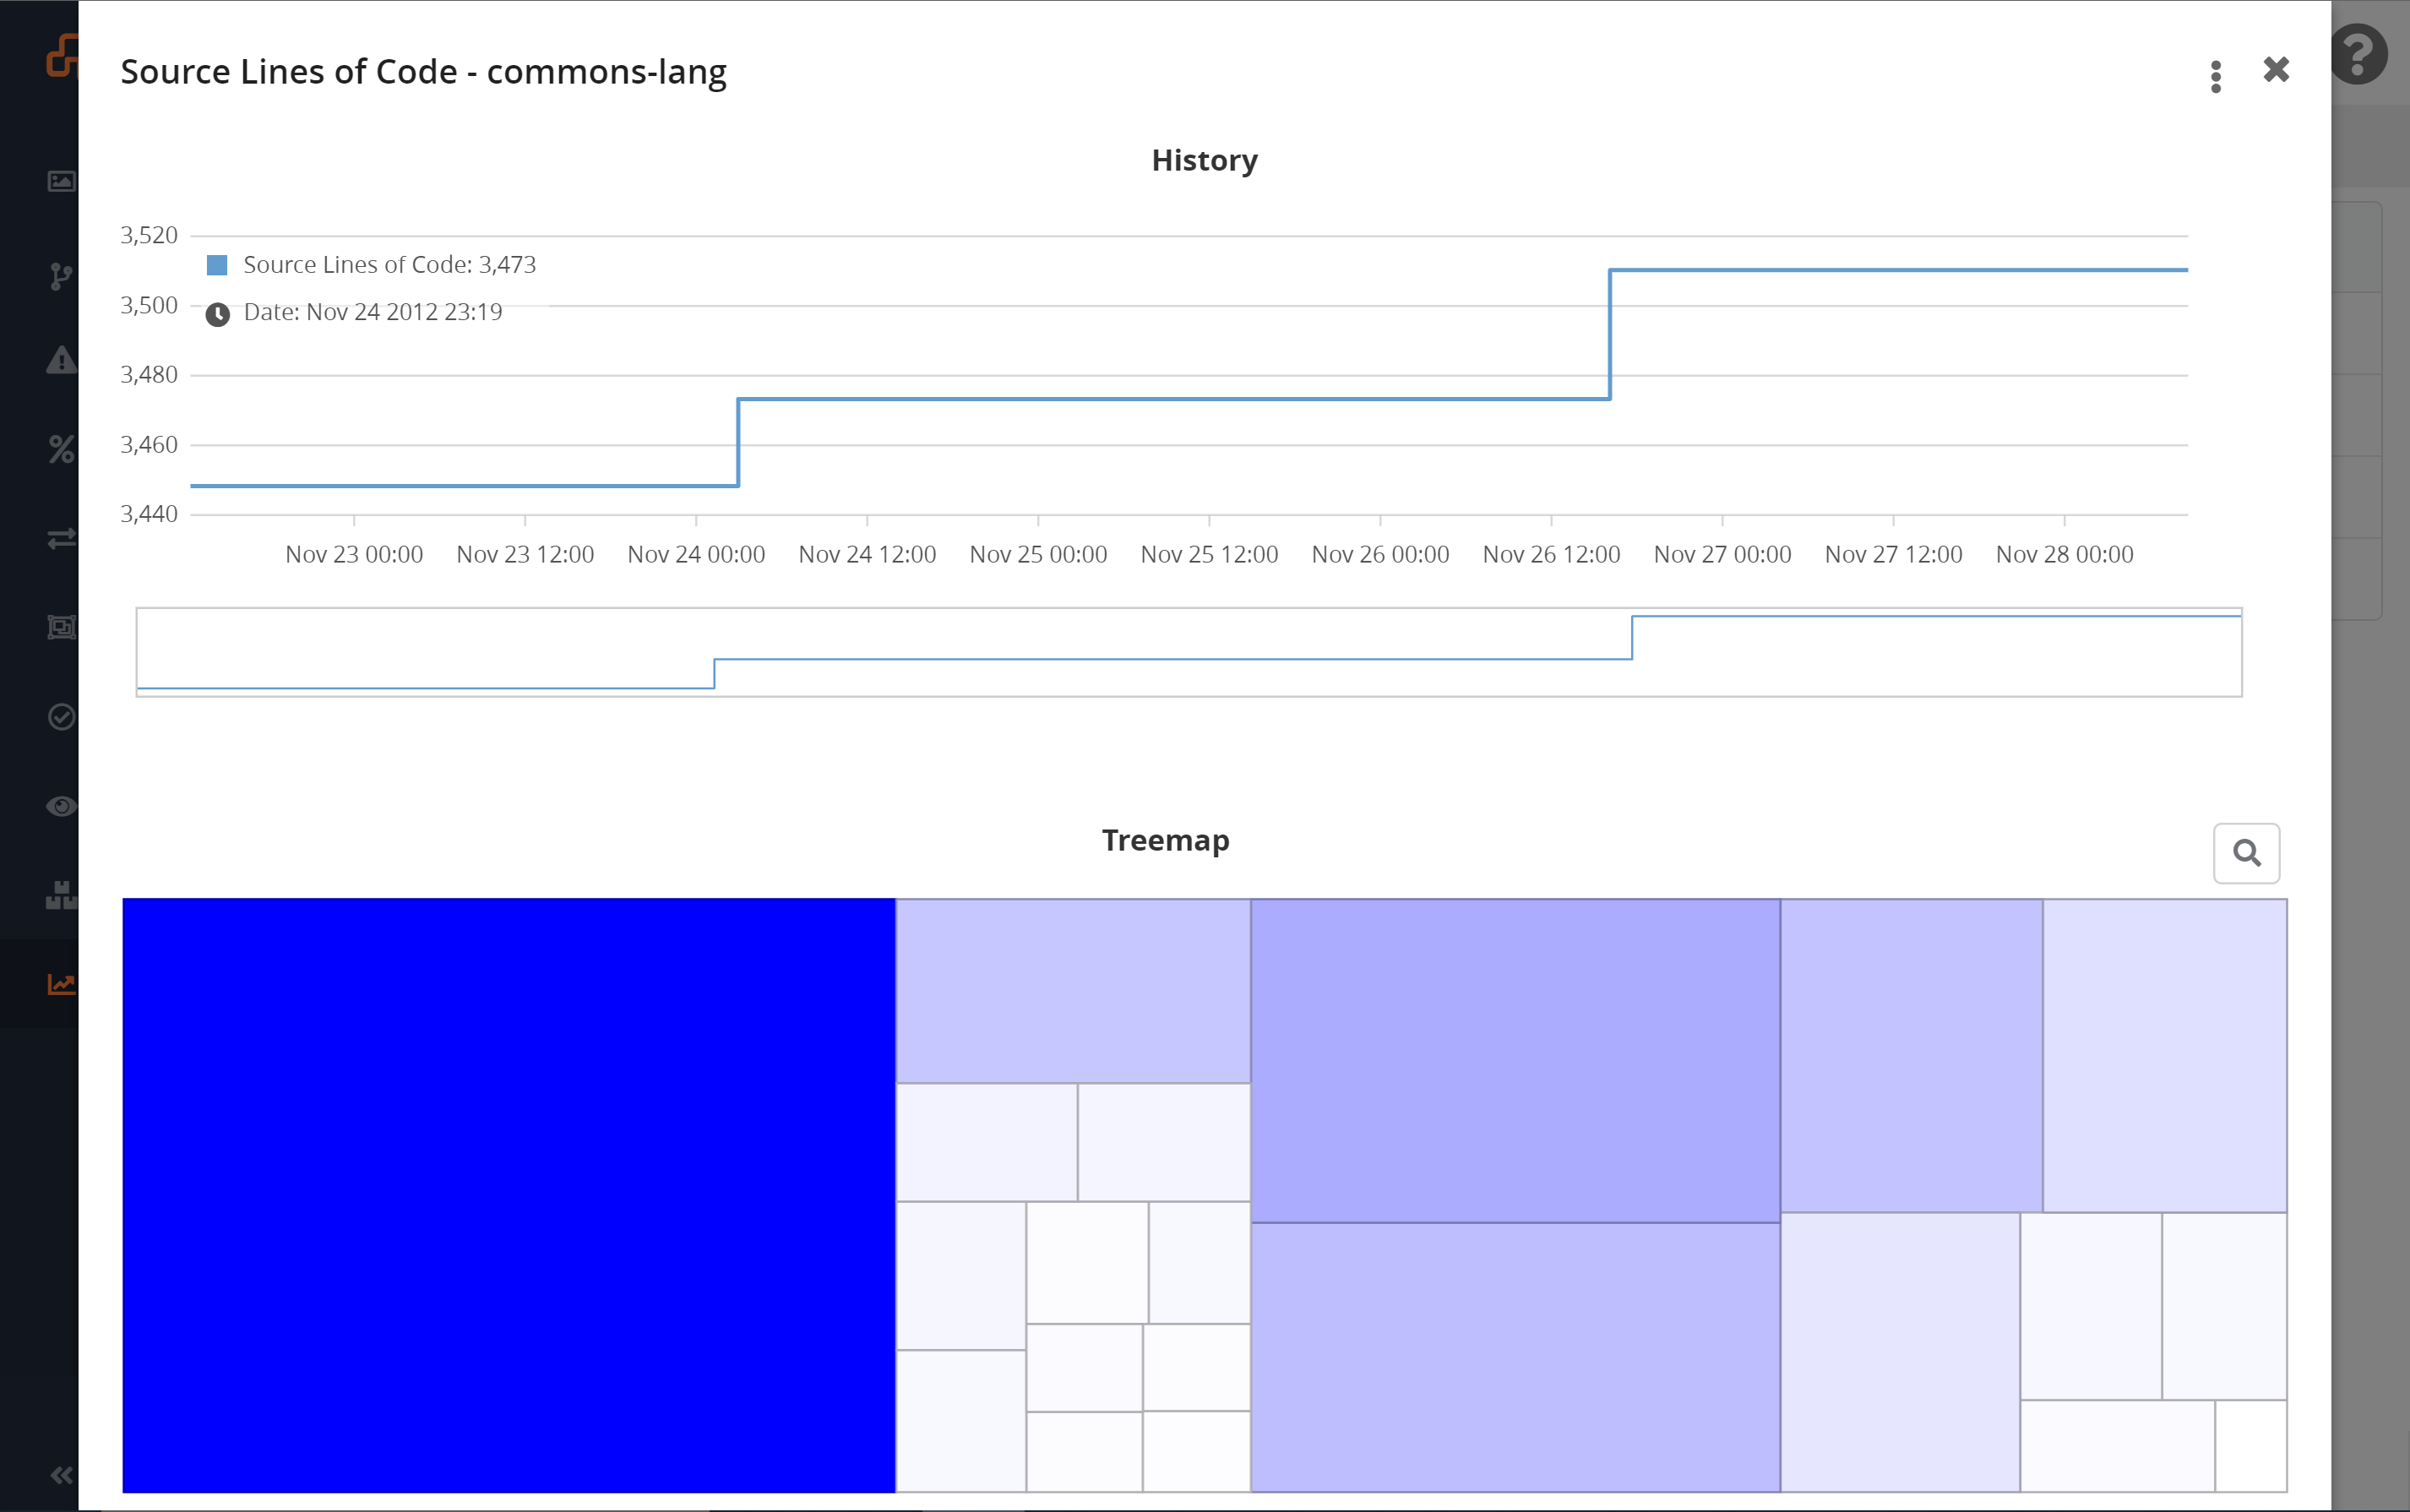
Each row can be clicked to open a dialog showing the history and treemap for the respective metric:
Navigating the Findings Churn
In addition to code churn and metric churn, the Delta perspective also provides the findings churn. Use the left sidebar to navigate to the Findings Churn Page.
Findings Churn Page
This page gives you an overview of findings which were added ( New Findings ) and which were removed ( Removed Findings during the selected time interval. Additionally, it also shows you findings in code which was changed during the time interval. This is relevant if you selected quality goal improving for your project. Under this quality goals, findings in changed code should be removed on-the-fly. Hence, this page shows you the opportunities you missed.
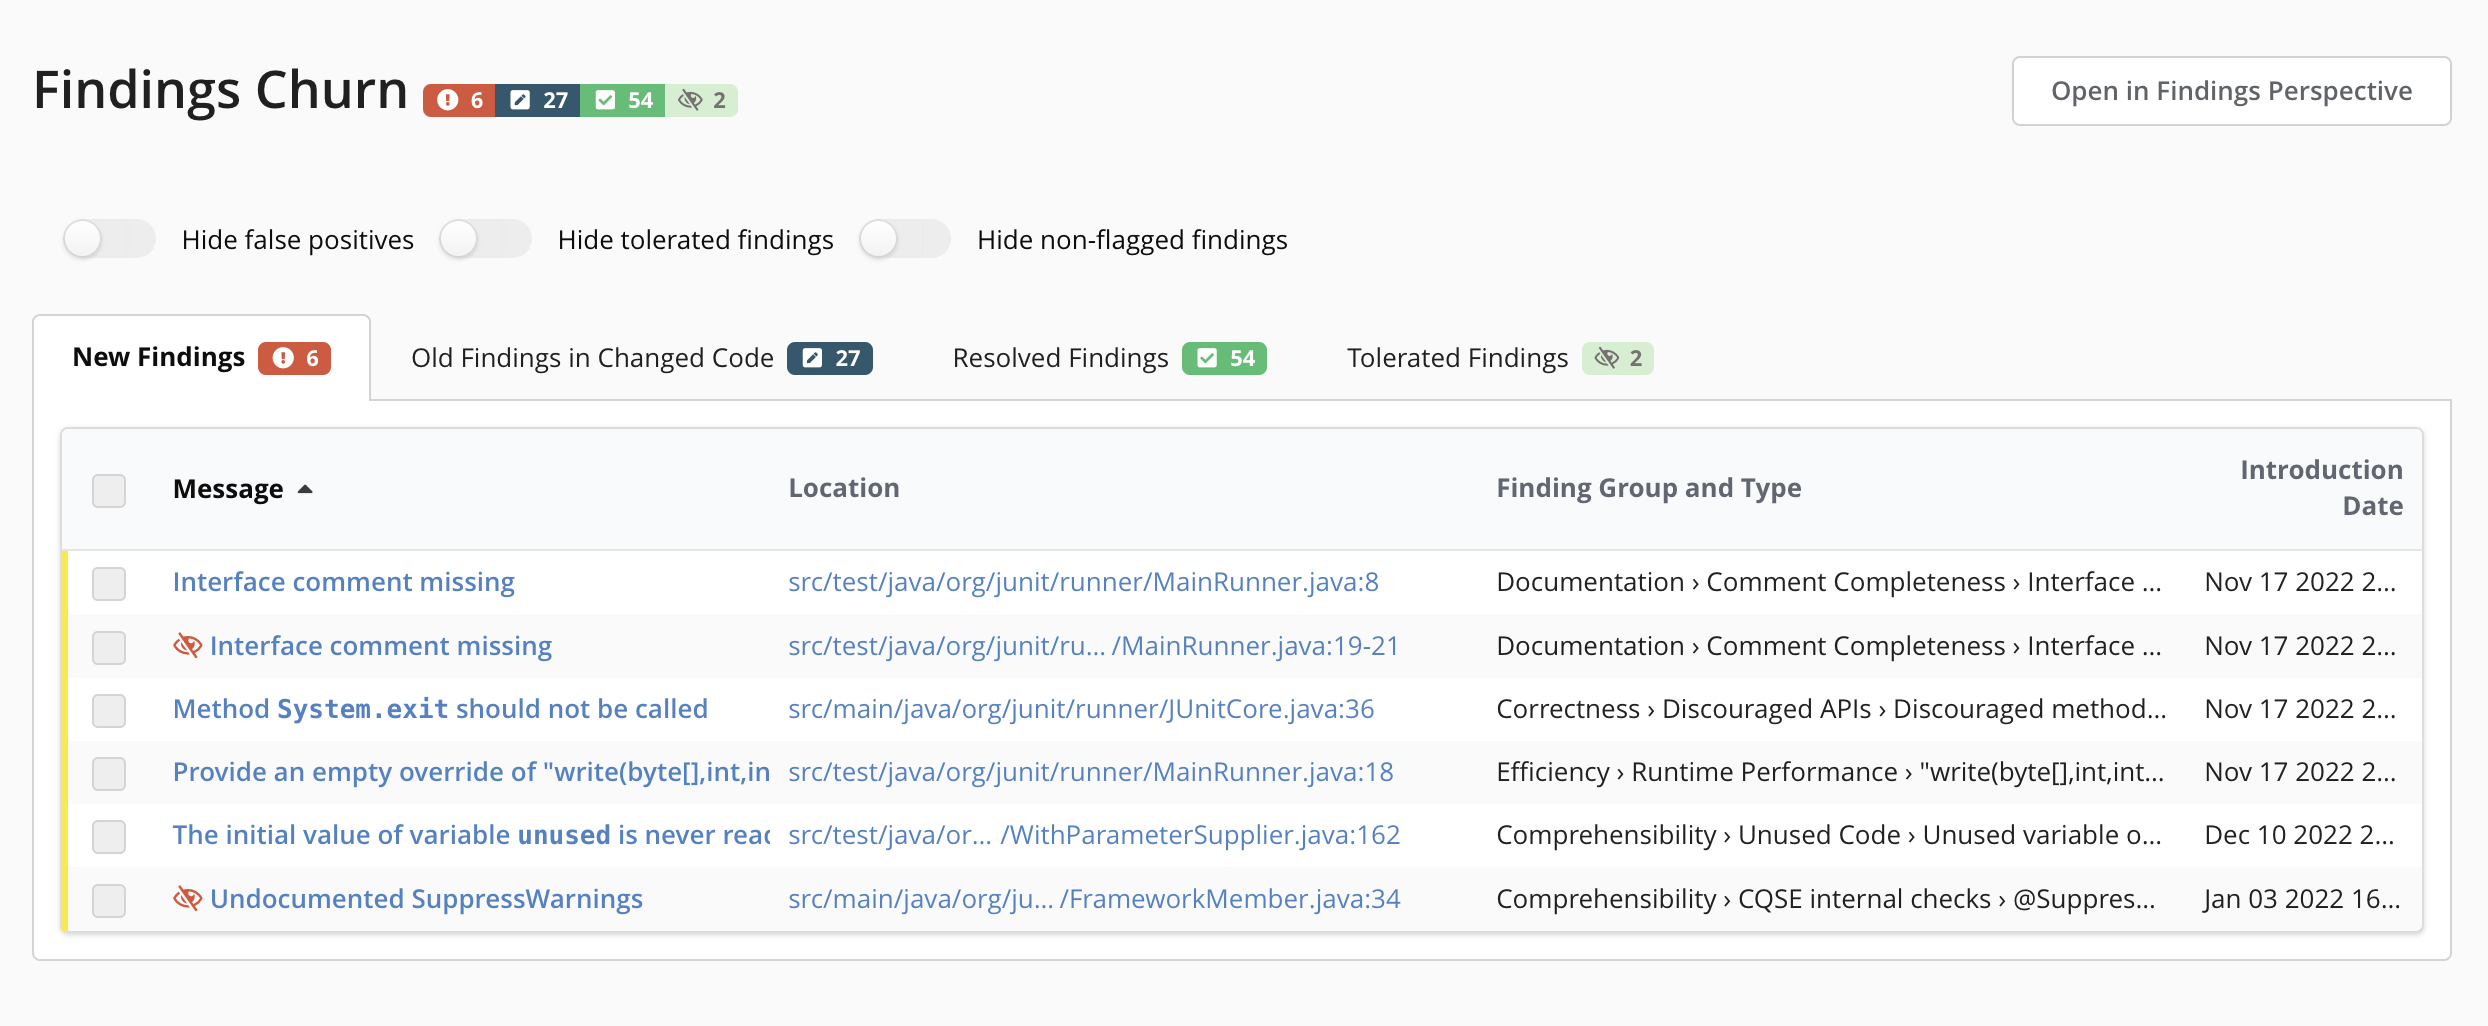
The table provides the message, the finding location as well as the finding group. Clicking on the messages opens the Findings Detail View of the Findings perspective, clicking on the location redirects you to the Code Detail View.
Additionally, the sidebar offers the same filter mechanisms to navigate the findings as the Findings perspective: You can filter by entering a regular expression or by selecting specific finding categories or finding groups.
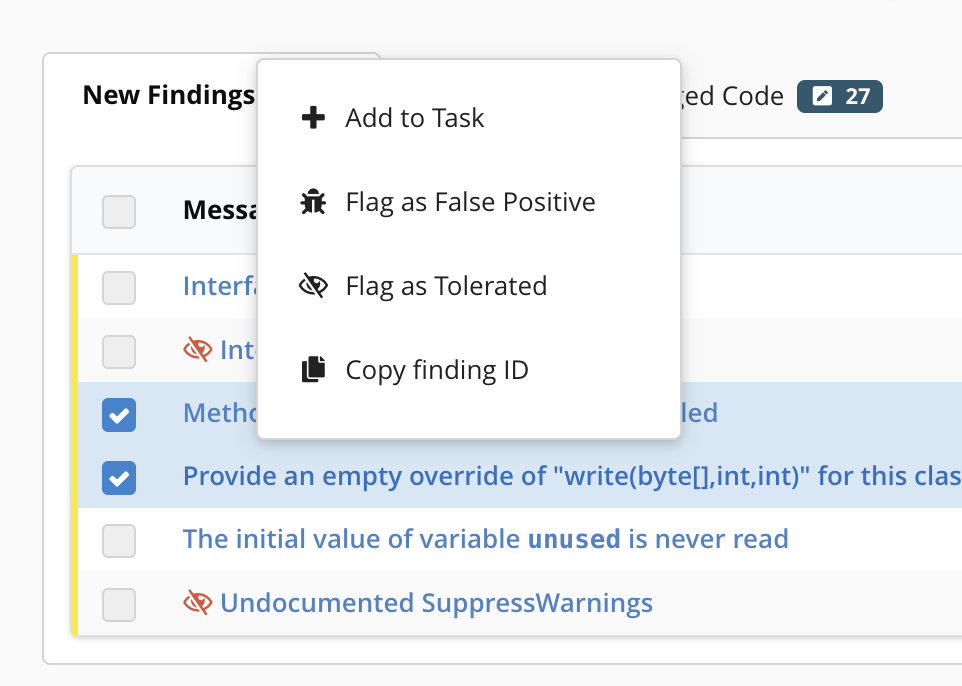
You can also select multiple findings by clicking on the checkboxes and then right-click to perform actions on all findings at once.
Further Reading:
- Incremental Origin Analysis of Source Code Files
D. Steidl, B. Hummel, and E. Juergens, in: Proceedings of the 11th Working Conference on Mining Software Repositories (MSR’14). 2014