Dashboard Perspective
After logging in, Teamscale puts you into the Dashboard perspective. A dashboard is a way to get a quick overview on a project’s current state. Dashboards are configurable collections of widgets, with each widget showing a specific project characteristic, e.g., the system size in lines of code or the distribution of method lengths.
Dashboard View
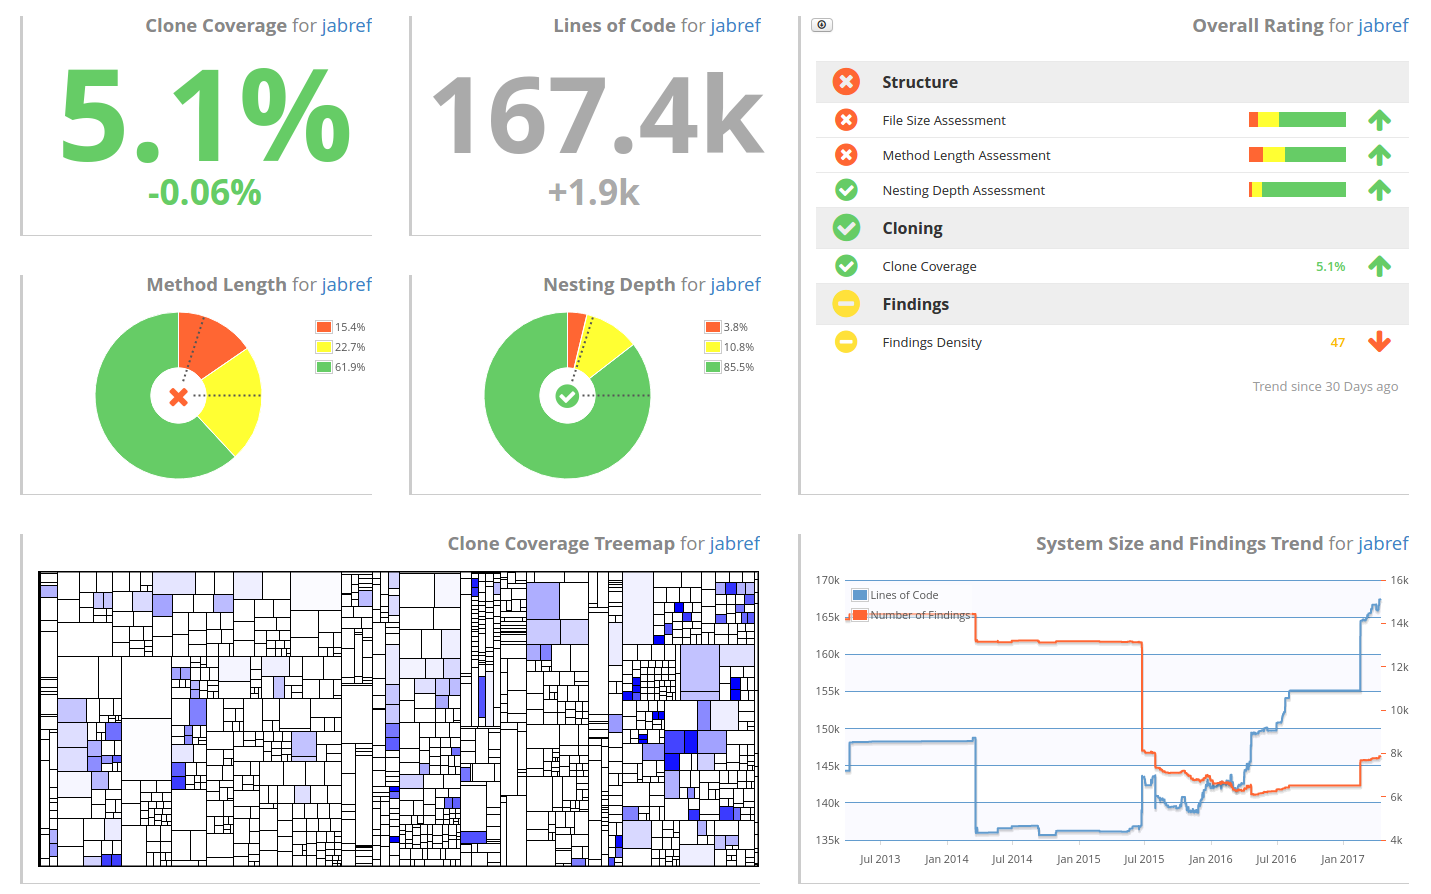
The image above shows the default Overview Dashboard for an example project, depicting various kinds of metrics. The first row in the top left consists of three differently configured numeric metric value widgets, showing the current values for the lines of code, clone coverage, and findings count (Findings Count), respectively, as well as the trend information with regards to the last seven days. Below are two Assessment Pie Chart widgets for method length and nesting depth. They show how the code base is distributed into methods that are assessed red, yellow, or green with regards to the respective metric. The Metrics Trend Chart widget in the bottom left shows the evolution of metric values over time, namely lines of code and Number of Findings. While there a large variety of Widgets to choose from, Teamscale comes with preconfigured templates to provide a starting point for customization. On the top right, the Findings Summary Bar Chart shows how the identified findings are distributed over the available quality indicators and finding groups. Finally, the treemap widget on the bottom right shows how the metric values for clone coverage are distributed over the code base. This makes it very easy to identify hotspots with regard to the selected metric.
Action: Creating a Dashboard
To create a new dashboard, you can use the + button at the top of the dashboard perspective.

After clicking the Add a new dashboard entry, you'll start with an empty dashboard canvas and a list of widgets that can be added to the dashboard. See the following subsection for more information about how to edit a dashboard. Alternatively you can select to start with a template instead. Selecting Create from template presents you with a dialog to configure a dashboard from template:

Here, you can enter the dashboard's name, select the template to create the dashboard from, and select the project and path that should be used by all widgets to display their data for. After confirming with OK, the newly created dashboard will appear in the dashboard dropdown, and you can share or edit it:

Action: Editing a Dashboard
To edit an existing dashboard, select Edit dashboard in the drop-down menu next to the dashboard's name in the top bar of the perspective. This will lead you to the Edit Dashboard View. You will be in the same view right after creating a new dashboard.
Edit Dashboard View
Once you are in the dashboard edit mode, the dashboard becomes editable, and the sidebar changes to a list of buttons. Clicking either of them adds a new widget of the selected kind to the dashboard. There are plenty of widgets to choose from. Which widgets to choose strongly depends on the particular use case.
Widgets Overview
Here is an overview of available widgets and their configuration options.
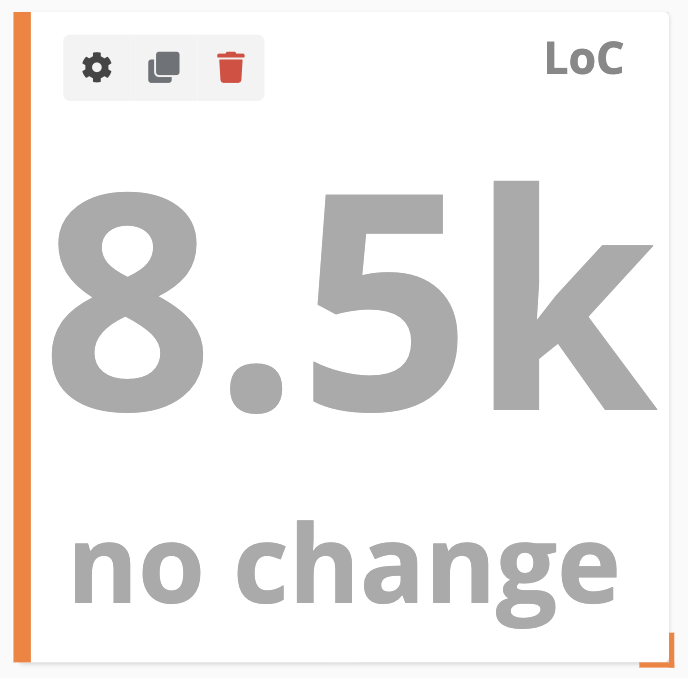
Most widgets are configurable to a large degree, e.g., by selecting which metric(s) to show, which path to consider, the applicable timespan and many more options. Each widget on the canvas is enhanced with a row of buttons to enable configuring, duplicating, or deleting a widget:
| Opens the options dialog for the respective widget. | |
| Duplicates the widget | |
| Deletes the widget from the dashboard. |
To move a widget across the dashboard, you can drag it via the orange bar on the left. Resizing is possible using the orange corner on the bottom right:
Widgets differ widely in the parameters they provide. Therefore, we illustrate the general concept rather than each individual widget here.
This image shows the Numeric Metric Value widget's parameters as an example:

All widgets share the Title and Path parameters. These can be used to alter the widget's title and change the project and path for which to display the data. If the path should not be shown on the widget, you can hide it using the check box. Further parameters are provided on a per-widget basis. Usually, they provide tooltips with further information on how to use them when you hover over the parameter name. When you are done editing the widget parameters, OK closes the dialog and applies the changes to the widget.
Action: Saving and Sharing a Dashboard
When you are done editing a dashboard, you can save it via the Save or Save as buttons:

The former will overwrite the current dashboard, while the latter will create a new dashboard.
Once your dashboard is configured to suit your needs, you may want to share it with you team members. Teamscale makes it easy to do just that. A click on Change permissions in the dashboard's edit menu in the top bar brings up the Role Assignment View, where you can configure access rights for individual users or groups:

For every user or group you grant access to your dashboard, you can select whether they should be allowed to read, write or own the dashboard. When you share your dashboard with colleagues, it will appear in their dashboard dropdown. You can use the "Only my dashboards" toggle to only show dashboards that you have created.
A dashboard is considered yours if only your user has explicitly been granted the Owner role. When you create a dashboard you automatically become an Owner of that dashboard. You can transfer the ownership of the dashboard via Change permissions from the edit menu.
Automatic Log-In for Dashboards
If you want to keep the dashboard open on a public screen, Teamscale's ability to login automatically with using a special link may be helpful.
Action: Timetraveling in a Dashboard
In general, dashboards can not only show a system's current state, but can go back to any point in its history. The Dashboard perspective has the timetravel feature available as described here. After selecting a date in the Timetravel dialog, the dashboard will display the system's quality status at the selected point in time. Setting the timetravel will update the content of all widgets in the selected dashboard. It will not be transferred when you switch dashboards.
Action: Managing Templates
The dashboard perspective also allows you to manage all templates. You can click on at the top in the Dashboard View and then select Manage dashboards. This will take you to the Template Management View.
Template Management View
The Template Management View lists all available dashboard templates. In the example screenshot, it currently contains only one dashboard, which is the default Overview Dashboard along with its short description.
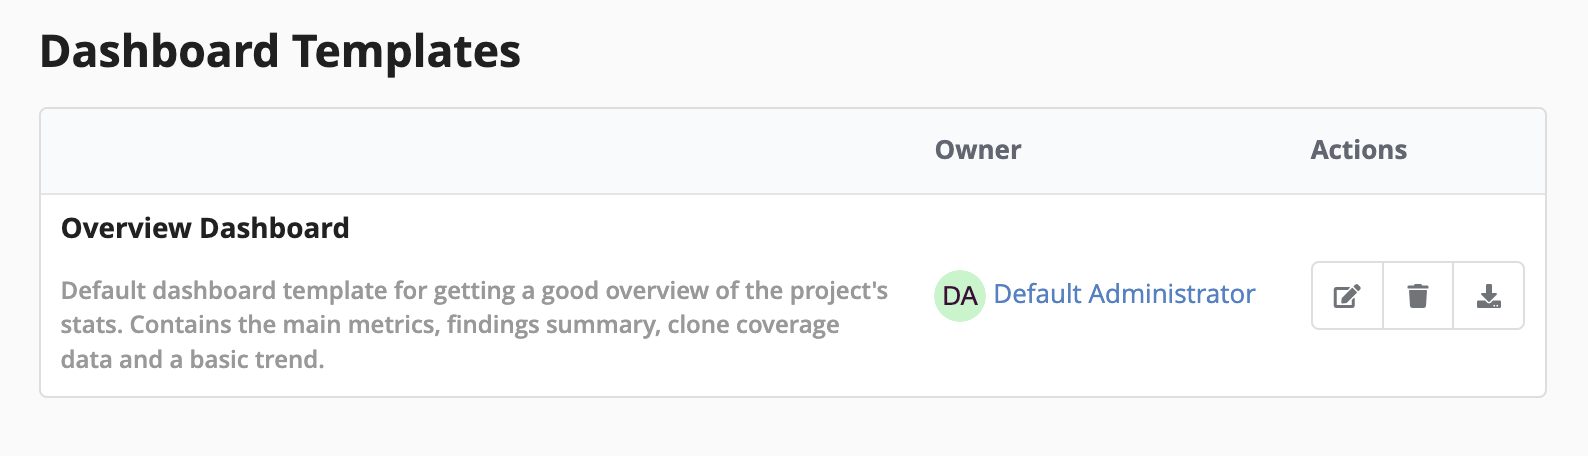
To create new templates, you can go back to the Dashboard Overview View and use the dropdown menu right next to an existing dashboard's name in the right side bar. It contains the option Save as template which will create a new template based on the layout from the existing dashboards. The Template Management View further allows you to edit , delete and export a template with the buttons next to each template.