How to Create an Analysis Profile
Teamscale comes with pre-configured analysis profiles for all supported languages. These provide sane default values for all analyses. Not all available analyses are enabled by default, though. When starting out, it is usually a good idea to start with the default profile for a language and customize it later to fit your needs. Each project uses exactly one such profile.
Multi-Language Support
A single analysis profile can cover multiple programming languages.
In the left sidebar, click on Project Configuration → Analysis Profiles .
To create a new analysis profile from scratch, use New analysis profile or import an existing (previously exported) XML file by using Import analysis profile. If you want to edit an existing analysis profile, click its button. The other buttons in this row can be used to duplicate a configuration , delete it or download it as an XML file .
TIP
To use one of the default profiles as basis for configuring a custom one, we recommend to copy the default profile, and then edit the copied version afterwards.
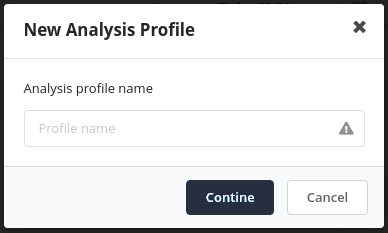
Next, the create analysis dialog will appear to ask for a new unique name for the analysis profile:
After clicking Continue the view will redirect to the Check Explorer and open the new profile for editing. By default, the Check Explorer will be empty, as there are no languages selected so far.
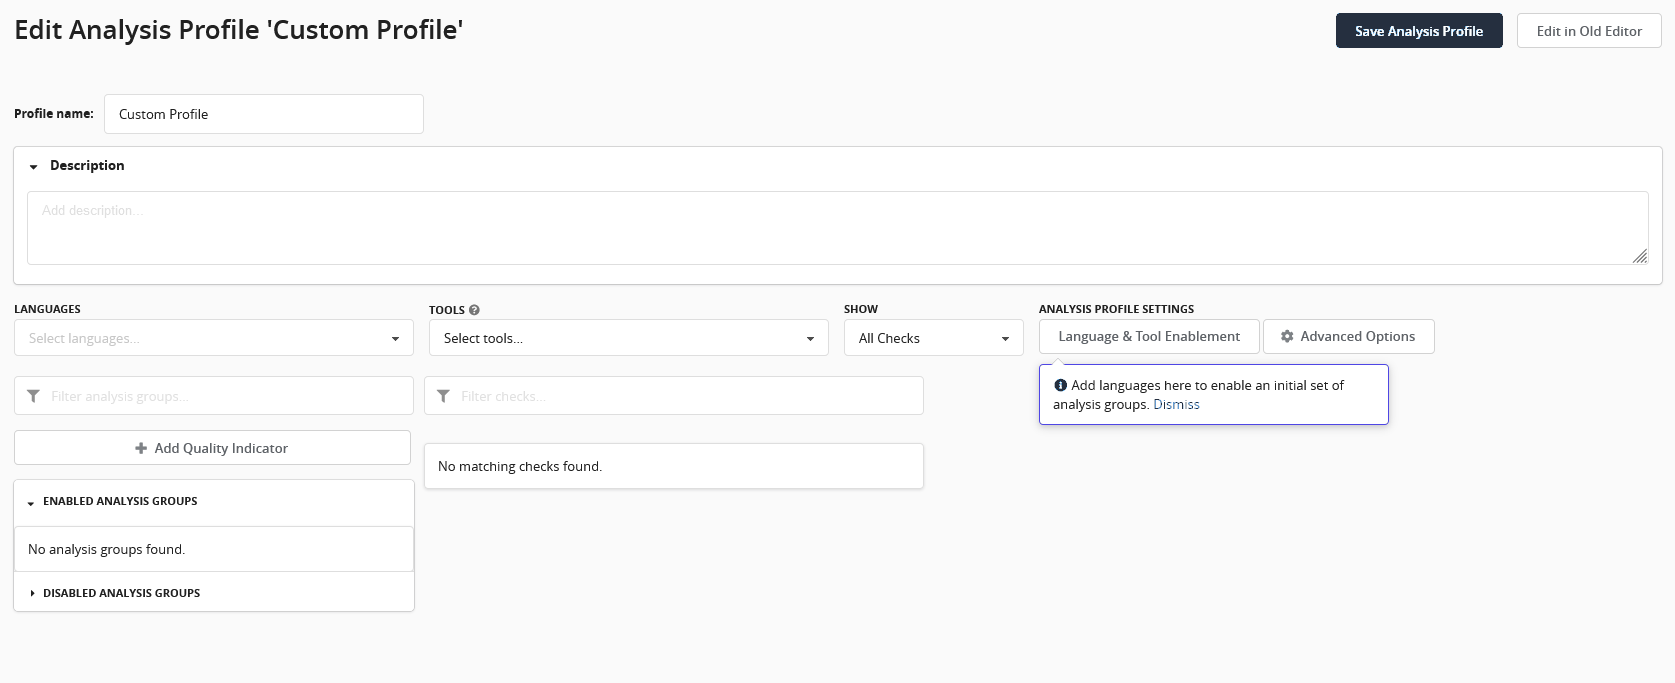
A hint is shown on the screen to guide where languages for the profile can be added. Selecting a language will fill the profile with the default pre-defined set of quality indicators and analysis groups for this particular language. This set can be further customized as needed.
For more details on editing analysis profiles in the Check Explorer, please refer to this page.