Recording Test Coverage for Manual Tests
Test Gap analysis (TGA) works not only for automated tests but also for manual and exploratory testing. It reveals recent code changes that your manual tests have not covered. These have a very high likelihood of causing production defects and it is thus a good idea to make sure you're not accidentally shipping untested code changes to production. The TGA continuously identifies and highlights these untested code changes (so-called Test Gaps) while you are testing so you can adjust your manual testing behavior to cover all risky untested code changes before a release or the end of your sprint.
The Principles behind Manual Test Coverage
In order for the TGA to work, you need to provide test coverage for your testing activities. This is achieved by using a coverage tool, a.k.a. a profiler, on your deployed test system. Whenever someone performs a manual test, the profiler will track all code that is executed as a result of the testing activity.
For example: you click a button in your UI, this triggers code that handles button clicks. The profiler will register that this code has been run and record test coverage for it.
These are the same tools that you would use to record test coverage for your automated tests. In essence, it doesn't matter to the profiler whether code is executed as a result of a user interacting with the UI, a UI testing tool clicking on buttons or a unit test directly calling some application code. The profiler simply records all code that is being executed while your application is running.
This is true even if you'd like to record coverage for a backend system which is distinct from the UI the tester is using, e.g. a Java backend that users access via a JavaScript web frontend. In this case, the user interaction with the frontend will trigger requests to the backend that in turn cause your code to be executed. The profiler simply tracks all executed code.
How Can I Set Up Coverage Recording for My Manual Tests?
We have several resources to help you get started with recording test coverage for your manual tests:
- Our tutorial for Java shows you how to record test coverage for manual tests of any Java application. We also have a specialized how-to for Java applications running inside Docker images.
- Our tutorial for .NET shows you how to record test coverage for manual tests of any .NET application.
- In general, our list of recommended coverage tools is a good starting point to help you decide which tool is suitable for your needs.
In all of these cases, the profiler is attached to your application, records coverage and either writes the result to disk as a coverage report file or directly uploads the coverage data to Teamscale.
How Can I Use the Test Gap Analysis for My Manual Tests?
Once you have obtained test coverage for your manual tests, Teamscale automatically calculates your Test Gaps. You can analyze these in two ways:
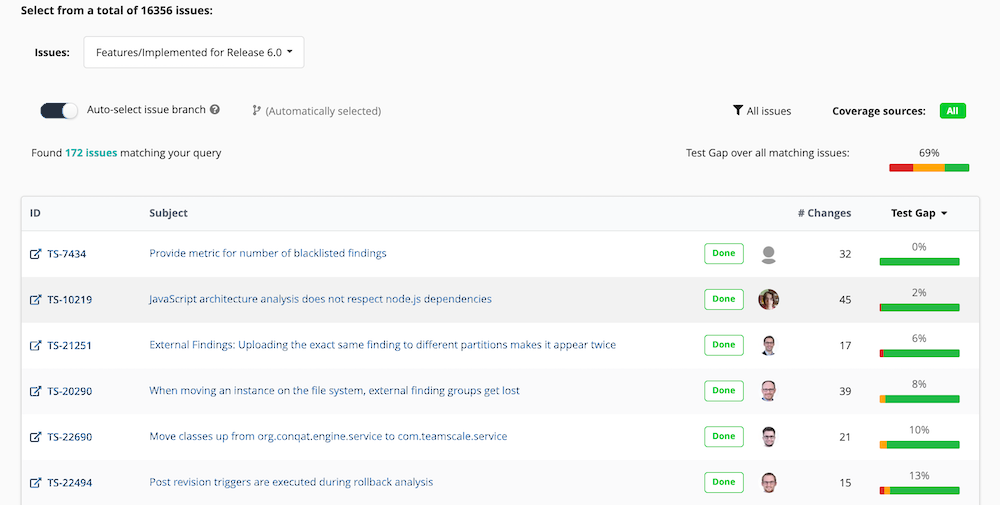
Based on individual bugs and features from your issue tracker. This answers the question "how well did we test this issue or set of issues?" and is especially useful for regular manual tests that accompany an agile sprint or iteration.
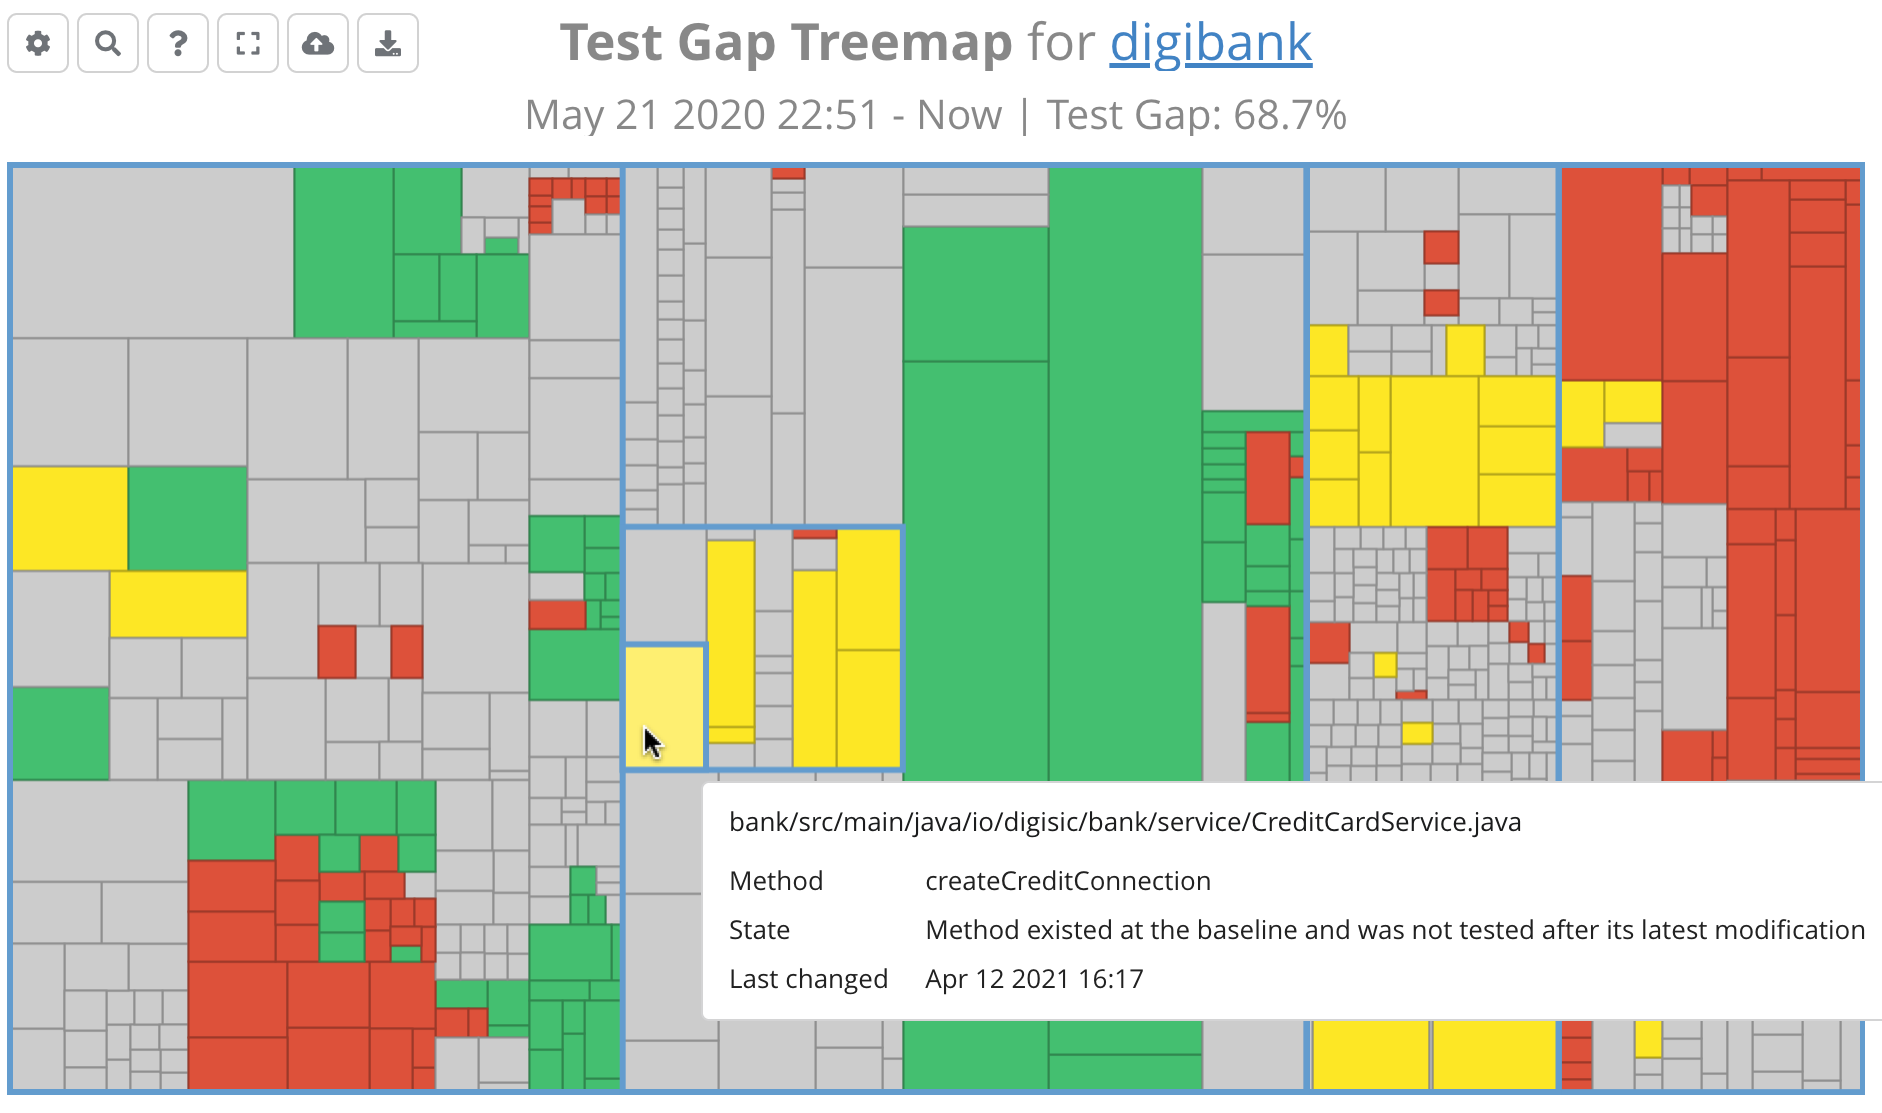
Based on (a subset) of your source code. This answers the question "Are there any big untested code changes we should address before we release our software?" and is especially useful for guiding exploratory tests and as a last sanity check before a release.
Webinar:
Webinar on Test Gap Analysis
- 0:00: Motivation and Basics
- 33:30: Practical Examples and Technical Details
- 52:44: Live Demo
- 1:10:30: Cost-Benefit Analysis