The Check Explorer
This page allows you to explore the different checks available in Teamscale. For this purpose, you can find it at different locations throughout the Teamscale Web UI:
- When you click Check Explorer in the menu that is opened when clicking the question mark in the upper right corner
- When you click Checks in the Findings Perspective, which shows you an overview of all the checks of a specific project
- When you select an analysis profile in the Analysis Profiles View and then click View in Check Explorer
- When you click the -button in the Analysis Profiles View to edit an analysis profile. See Editing an Analysis Profile for a guide on editing an analysis profile.
Filters and Options in the Check Explorer
The Check Explorer will contain different available filters depending on the context, such as inspecting the checks in an analysis profile:

At the top of the check explorer you can read the description of the current analysis profile. Below that, you can use the Languages and Tools filters to view the checks available for multiple programming languages and tools. However, while inspecting the checks of a specific analysis profile or project, their options are limited the ones enabled for the corresponding profile/project.
In order to show only those checks which have been added with the last Teamscale update, but remain to be configured for the current analysis profile, you can click the Only show unconfigured checks toggle. If there are any unconfigured checks, it is enabled by default.
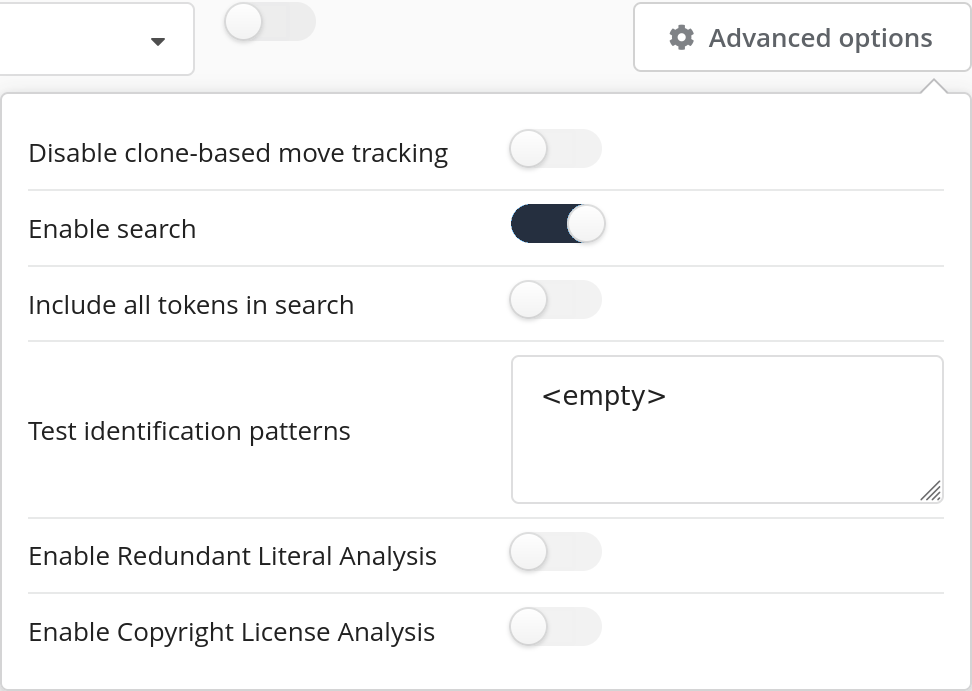
If you click on Advanced options, a menu with a number of additional options is shown. In order to be able to change them, you have to edit the corresponding analysis profile. You can begin editing the current analysis profile by clicking the Edit button. A detailed guide how to edit an analysis profile can be found here.
Finally, if you would like to browse all checks instead of only those in the current analysis profile, you can click the Browse all checks button.
Quality Indicators, Analysis Groups and Checks
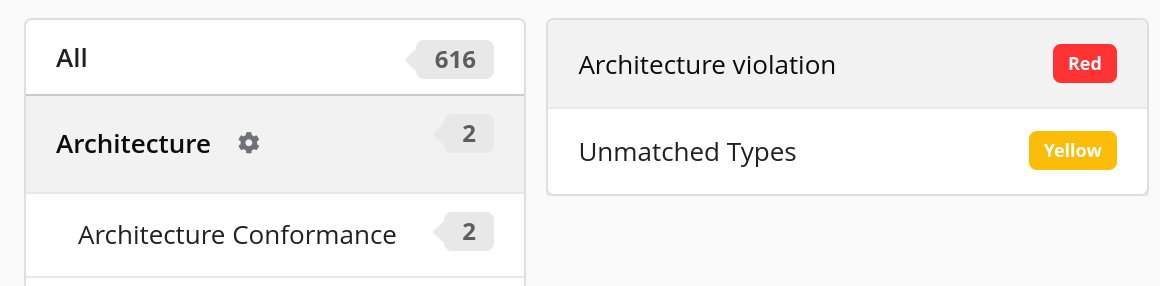
Below the different filters and options the different Quality Indicators, their Analysis Groups and the corresponding Checks are shown. The list on the left contains in bold the different Quality Indicators for the current analysis profile: They contain related Analysis Groups, which are shown below them. Small labels indicate the number of checks that belong to them and are not excluded by the current filter configuration. The list on their right contains their corresponding checks, as well as their current severity. Clicking on a specific quality indicator or analysis group in their list will show its corresponding checks in this list.
Furthermore, it is possible to filter the lists for specific quality indicators, analysis groups and checks using the Filter analysis group … and the Filter checks … filter.
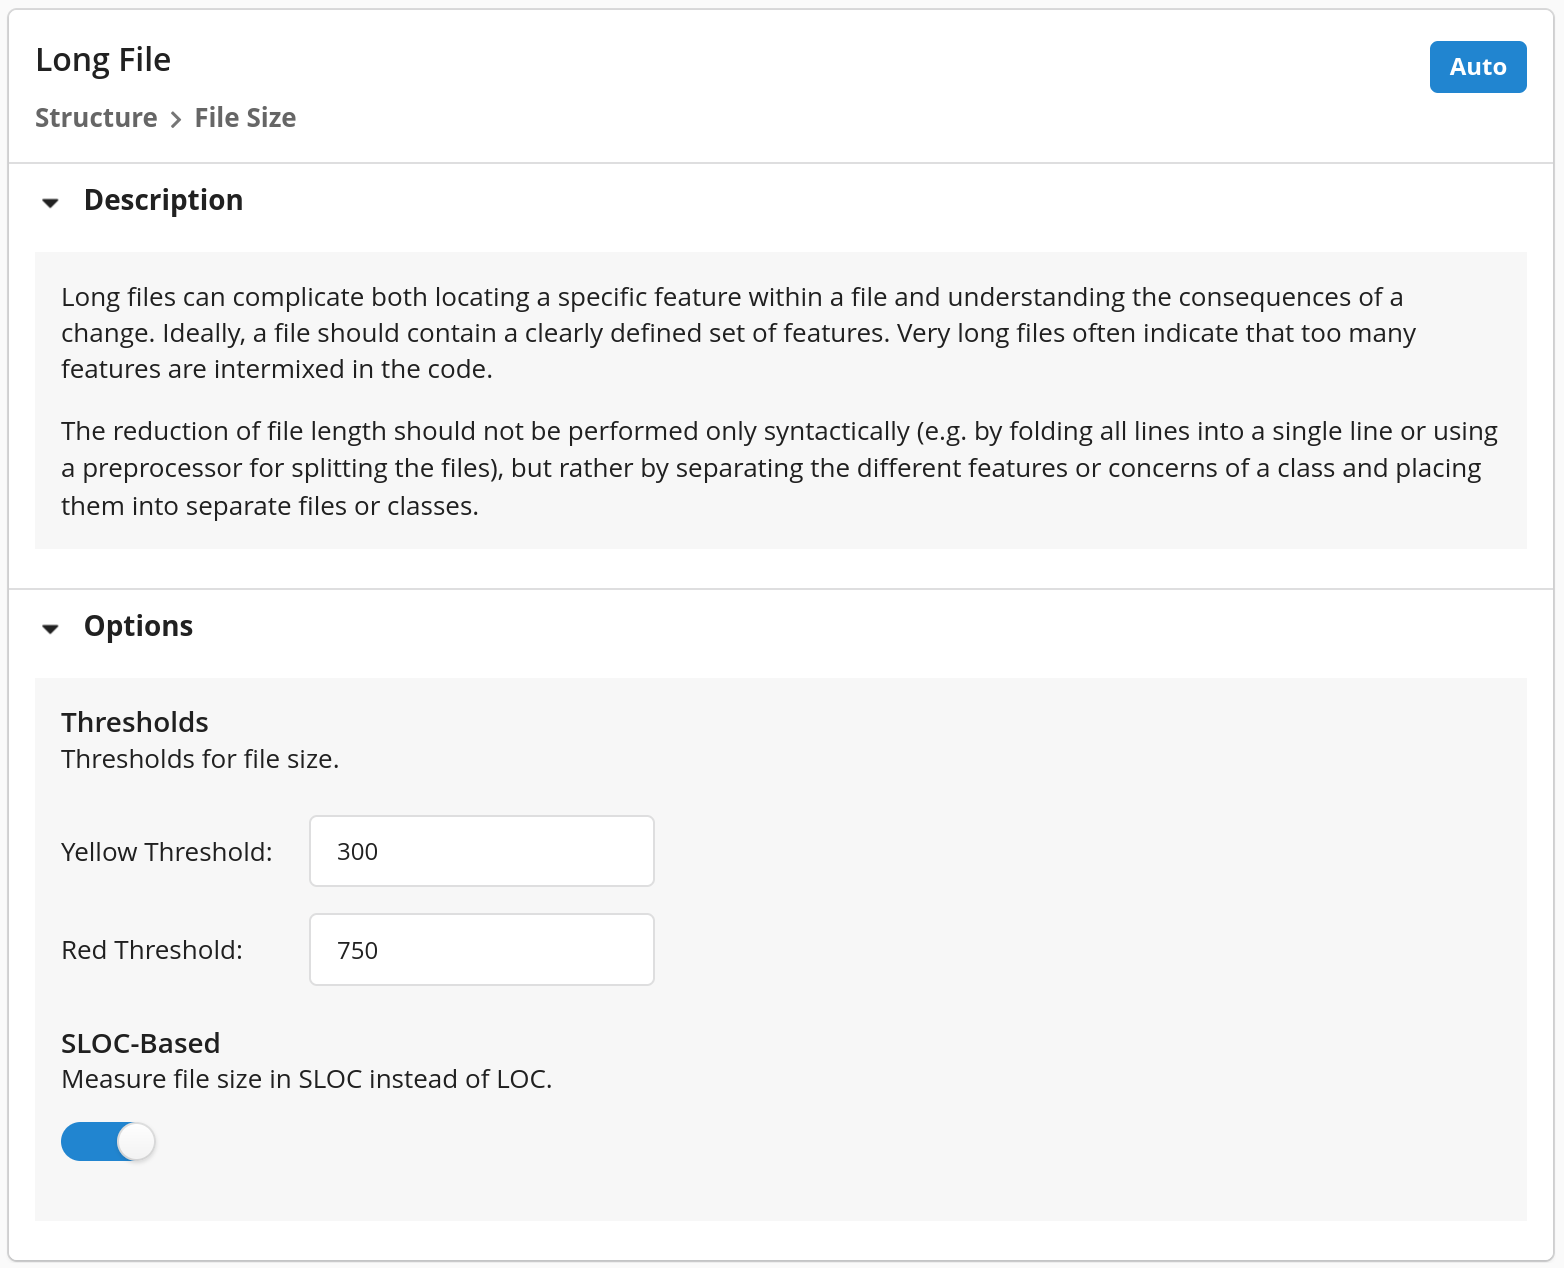
By selecting a single check you can view its description, severity and options on the right side of the check explorer: