Projects View
This page allows you to create projects to be analyzed by Teamscale. Projects in Teamscale are linked to one or more source code repositories and the findings that Teamscale generates and collects for the corresponding source code artifacts.
After the project is set up, it appears in the project list. For each existing project, the project list offers different buttons for project management (see table below).
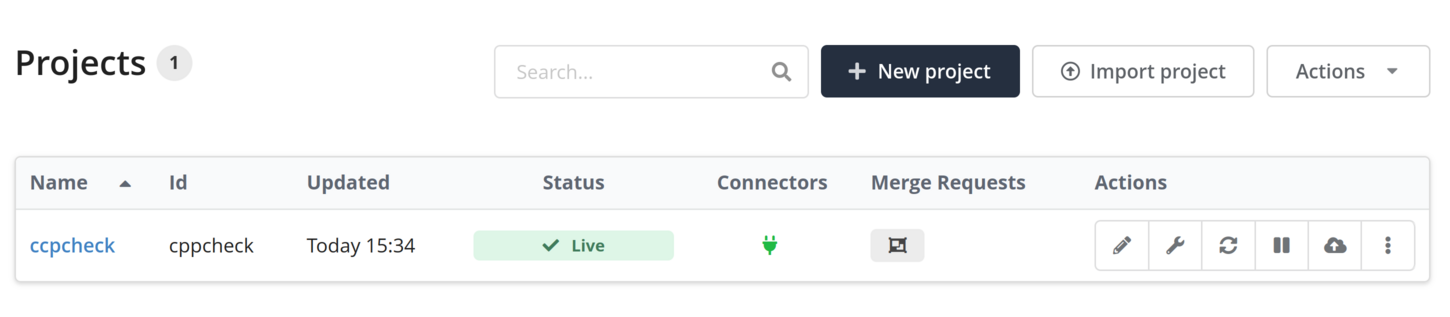
On the Projects page, you can see a list of all projects configured in Teamscale. The following actions can be performed on an existing project.
| Opens the edit dialog for the project. The dialog is the same as for project creation, except that project ID renaming requires some extra care. | |
| Opens a dialog for advanced configuration options such as a connection to SAP systems and the threshold configuration to use for the project. Teamscale defines a default threshold configuration but users can create custom threshold configurations (also discussed in this section). | |
| Triggers a complete re-analysis of the project. | |
| Pauses analysis of the project. | |
| Deletes the project. | |
| Copies the project. The copy project page will allow to specify whether only the configuration or also all project data should be copied. | |
| Exports the project configuration. The exported file can be imported with the "Import project" button. | |
| Exports a complete backup of the project (including analysis results). The exported file can be imported with the "Import project" button. | |
| Opens a view for management of external uploads. | |
| Opens a view for providing access to the project via users or groups. |
Creating a Project
To create a project, the New Project button of the Projects page can be used. You need to set a project name and an analysis profile. Here, we chose the ABAP (default) profile as an example:

Furthermore, the user can choose a dashboard template.
A project can be configured with multiple connectors for
- Version Control Systems:
Connecting to Git Platforms (GitHub, GitLab, BitBucket)
While all these platforms can be accessed using the plain Git connector, using a more specific connector enables additional features, such as automatic update on push, and annotation of pull requests.
- Issue Trackers:
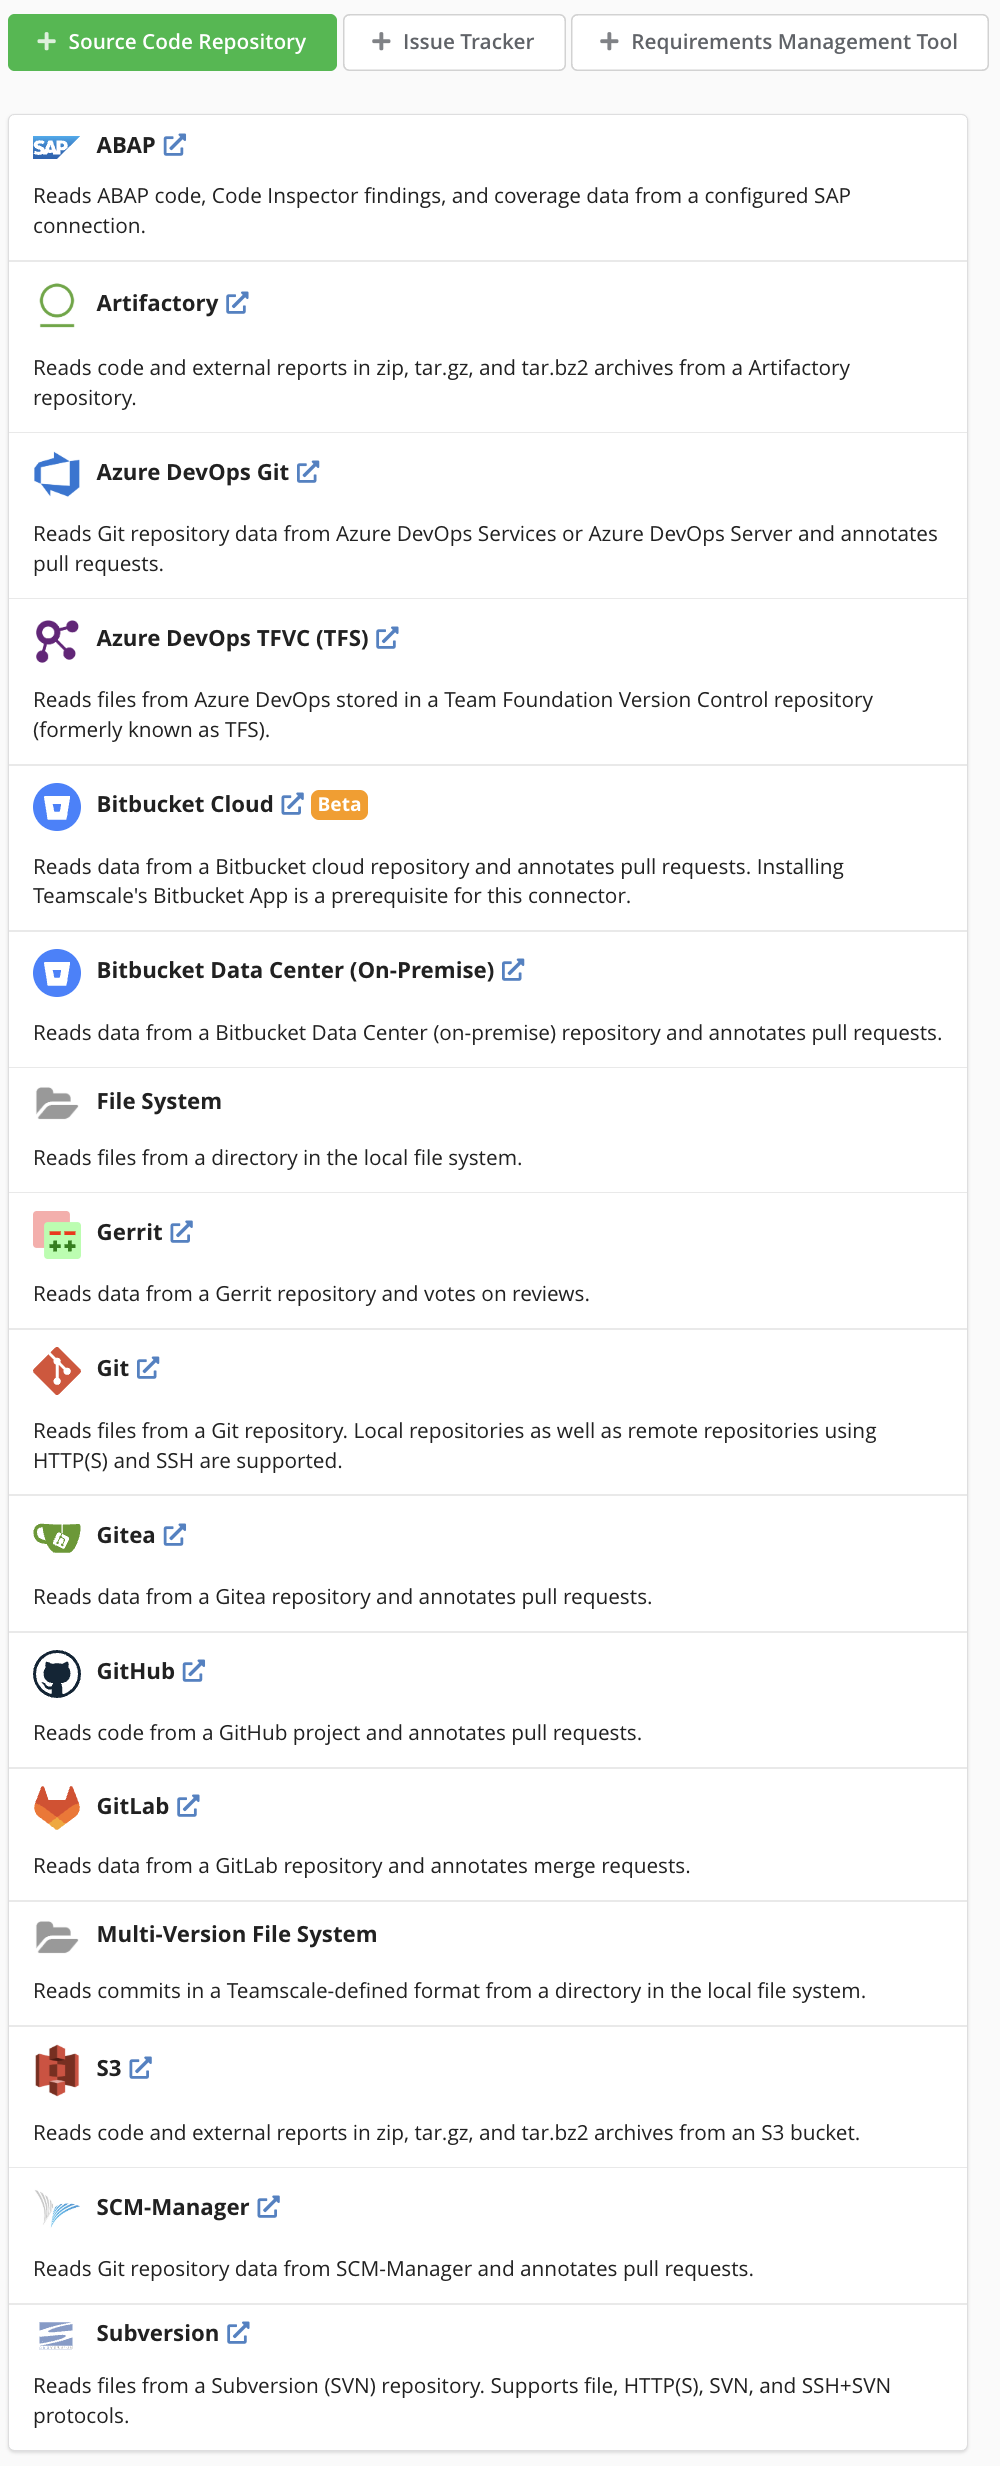
![]()
In terms of version control systems, Teamscale offers connectors to Git, SVN and Azure DevOps TFVC (TFS), as well as the Git management platforms GitHub, GitLab and BitBucket.
In addition, it can also read from the file system, either with a simple File System or a Multi-Version File System connector. For these file-system connectors, access to the file system needs to be made available by a Teamscale administrator via Admin → Settings using the File-System-Access Allow List option.
Git Connector
To set up a Git connector, the user has to specify account data (the + button opens an account setting dialog), and a repository identifier (must be unique in the project). Furthermore, the user can specify a start revision to reduce the analysis load and include or exclude files. You might, for example, want to exclude generated code or experimental code from the analysis. Also, you might want to have separate projects for your application and your test code. Note that Teamscale should be connected to either a remote repository (Teamscale will clone it locally into a directory configured in the Server Settings page on the Admin perspective) or a dedicated local clone that is not modified by other tools or users.
Local Git Repository
When connecting a local repository (file:// URL schema), make sure that the corresponding repository is bare, i. e. has been cloned with the --bare option.
Branch Support
Teamscale also offers branch support. As default, branch support is not enabled while configuring the connector for a project. For large projects with hundreds of branches, this would dramatically increase the analysis time. You can manually enable branch support by clicking the corresponding checkbox and configure which branches should be included in the analysis by using include/exclude patterns. The patterns are reg-ex based. For example, you can match your release-branches or specific feature branches. Internally, Teamscale has a default branch, which maps to »trunk« for SVN and »master« for Git. Sometimes, this has to be adjusted, however.
Multiple Repository Connectors
You can also use multiple repository connectors for one project. For example, you can read both from Git and SVN or from Git and the file system or from multiple GIT repositories. If you have two connectors read the same files and/or commits, Teamscale will merge these inputs into a unified view. In the Metrics perspective and the subsequent views, each file will only appear once. In the history of a file (Code Detail View) and in the Activity View, each commit for each repository will be shown separately. If there are multiple commits with the same timestamp but with different content (different changes), Teamscale will decide which of them to display as the »latest« commit. This choice also affects computation of metrics in the dashboard as the metric values might differ depending on the order of the commits (e.g., added lines of code). A situation where such overlapping commits are loaded can easily be generated by using multiple multi-version file-system connectors.
Branch Support For Multiple Repository Connectors
If you use multiple repository connectors and have branch support enabled, Teamscale will assume that branches with the same name can be mapped onto each other. Hence, Teamscale will only show one branch with the data from all connectors. However, if the branching structure is not consistent between connectors, this will not work, e.g., if you have a SVN connector followed by a Git connector. For this case, Teamscale provides expert options in the connector configurations. The option Branch transformation allows you to provide a manual mapping between branches. In our example, you would indicate »trunk → master«, for example.
Multi-Version File-System Connector
A multi-version file-system connector reads multiple versions of a repository that are stored in separate directories. The connector expects an input directory that contains one subdirectory per repository version. The names of the subdirectories must be numeric and are interpreted as Java timestamps.
An example of this directory layout looks like this:

The multi-version file-system connector expects that each subdirectory contains a full snapshot of the repository at the given timestamp. Each subdirectory is represented by a commit in Teamscale. If a file is missing in a subdirectory, it is treated as if it was deleted.
Please see also the detailed documentation on options for code repository or issue tracker connectors.
Code Scopes Configuration
Code Scopes are a powerful feature to allow defining different analysis settings and thus quality criteria for different parts of a project's code base. A common example is that projects may want to use different analysis settings for application code and test code. While in application code, quality aspects like security, error handling and code documentation may be considered as crucial, a project may choose to have weaker requirements for test code.
The Code Scopes Configuration section allows you to define an arbitrary number of Code Scopes where each Code Scope represents a subset of the projects' code files. Buttons allow to add, delete and reorder the Code Scopes for a project.
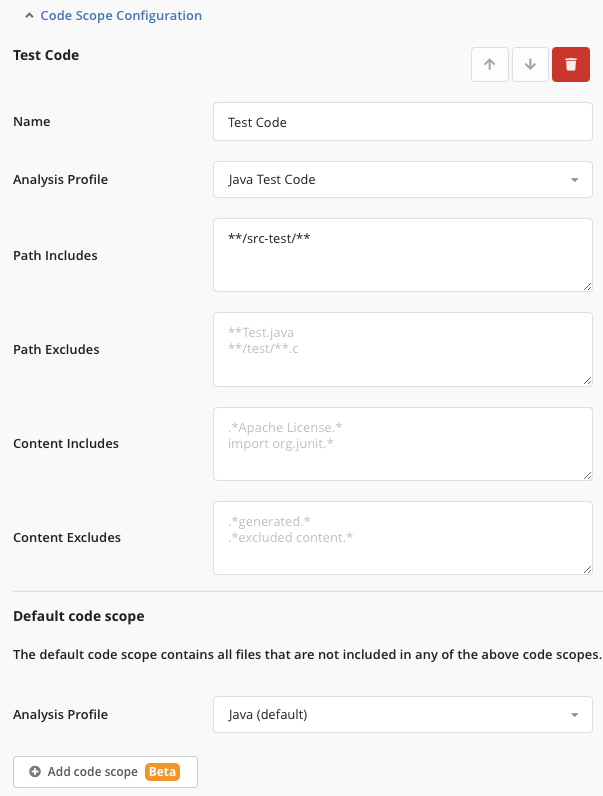
A Code Scope has a name, an associated analysis profile and parameters for defining path and content includes and excludes. Before analyzing the code, each file is tested against these includes and excludes and assigned to the first matching code scope (in the order of their definition in the project configuration). Consequently, Code Scopes are disjoint, i.e. a given file can only be assigned to one Code Scope. During the code analysis, every file is analyzed with the analysis profile specified in its corresponding Code Scope. The pre-defined Code Scope "default" is present in any project and contains any files that are not matched to any user-defined Code Scope. This also ensure that every file in the project is matched to a code scope.
In the Metrics perspective, a dedicated metric "Code Scope" allows to inspect the effective Code Scope(s) of files and folders.
The general aim of Code Scopes is to allow using different analysis settings for different parts of the code base. For some settings, choosing different settings is either not possible or not yet supported. This scenario is detected by a dedicated Code Scopes validation, which will report settings that are not Code Scope aware but configured differently in the analysis profiles used by the Code Scopes. To mitigate such validation errors, the user has to ensure a consistent configuration for the settings in question. This can require to first adjust the analysis profiles before the project configuration can be saved successfully. 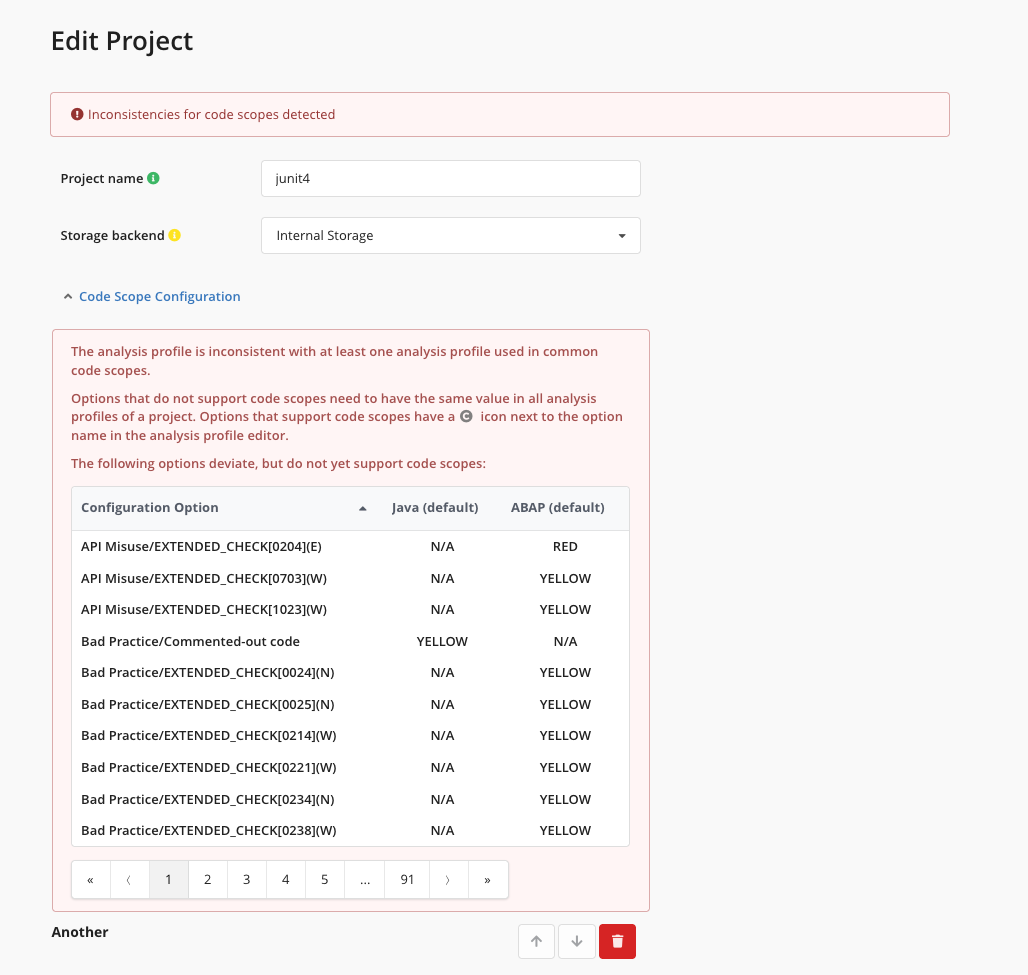
Branching Configuration
The section Branching Configuration allows to reduce the number of historic commits that Teamscale analyzes. Especially for repositories with high commit frequency, this has a huge impact on database size and time needed for the initial analysis. The general idea is that for most branches (e.g., feature branches) only the most recent history is relevant, while a longer history is often only relevant for main and release branches. To configure this behavior, the section Branching Configuration allows to define a start date for groups of branches defined by regular expressions. For this, the first row matching the branch of the commit is determined. Based on this row, the age is determined, which can be both exact dates or relative dates, such as "30 days ago". Depending on this age, the commit is then preserved or skipped.
Relative dates
Relative dates are resolved at runtime. This means that after a reanalysis, the history might look slightly different, as the relative dates are re-resolved during the reanalysis. In most cases, this is intended, as after a reanalysis, you typically again want to focus on only the latest few weeks or months in full detail.
External uploads
To list existing external-analysis uploads click on the button. The list linked in this button shows all reports that were uploaded to Teamscale. The list is ordered by the target partitions of the uploads (typically, uploads of each external tool such as Jacoco and FindBugs are stored on separate configurable Teamscale partitions). Each upload partition and each upload commit have buttons. You can also use the button of a partition to delete all uploads of the partition and the button of a upload to delete only the specific upload.
When a given upload is deleted, Teamscale starts a rollback to the latest commit before the upload in question and re-analyzes every following commit except for the deleted upload. Depending on the number and size of commits between the deleted upload and the newest commit, this partial re-analysis can take a significant amount of time.
Manual report upload
Assuming you already set up a regular Teamscale project and you have a supported coverage report available, a manual upload can be performed as follows:
Navigate to the Projects perspective
Click on the button for your target project
Click the
Upload Reportbutton in the top-right cornerIn the dialog, you can configure the following options:
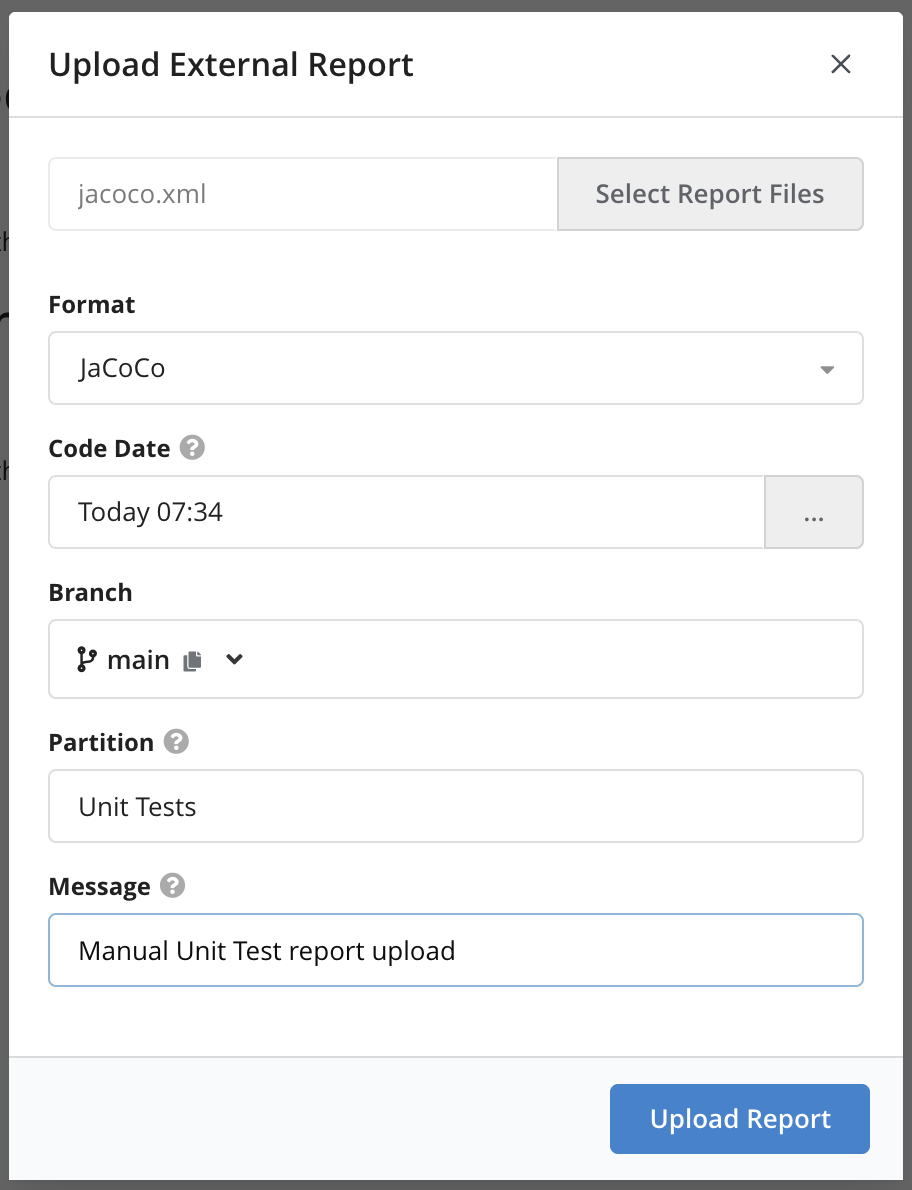
The coverage file to upload
Format: The coverage format of a supported test profiler
Code Date: This field must be filled with the date of the checkin in your VCS that corresponds to the version of your application for which the external report was created. e.g., for finding reports this would be the date of the VCS checkin for which the checker tool was run. For coverage reports this would be the date of the VCS checkin that was built and deployed to the test system. This allows Teamscale to link the correct state of the code with the uploaded report. The time can be set as a calendar date, baseline or revision.
Branch: The repository branch from which the coverage was created.
Partition: Reflects the report source. The value of this field allows to differentiate between several sources, e.g., manual tests and unit tests. In addition, the character
>can be used to show a hierarchy of partitions, which is rendered in a tree-like format e.g. in the Test Gap Overview and makes it easy to view coverage data for select partitions. For example, Unit Tests > Project 1 , Unit Tests > Project 2.Message: A message that will be shown in the UI, which can be used to identify the upload, e.g. "Unit Test Coverage".
After you specified the options above and clicked Upload Report, Teamscale will process the coverage report.
Verifying that an upload commit was successful
To verify that your upload was successful, you can navigate to the Activity perspective and check whether you can see an upload commit similar to this one:
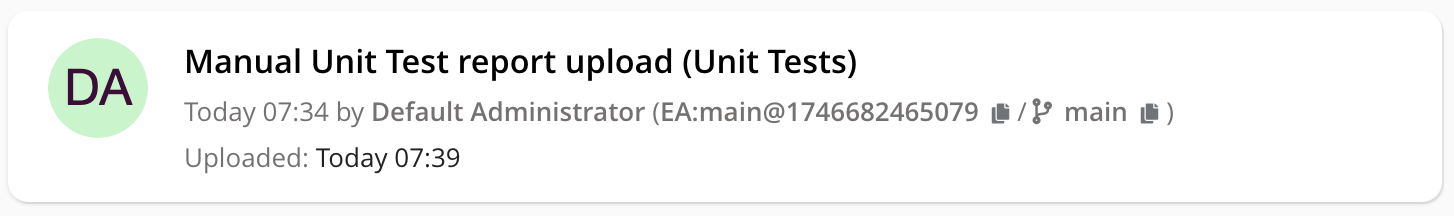
Note: Be sure to select the correct project and branch and navigate to the timestamp you selected for the upload.
If the coverage information and code known to Teamscale could be matched correctly, the details of the upload commit will show files covered by the upload as "changed". If no files are affected, this can e.g., indicate that the code paths in the coverage report are not equal to the paths in Teamscale.