How to See Aggregated Data for Arbitrary Code Areas
Teamscale allows you to view data like metrics or findings for specific parts of your code. There are two possible cases here:
Case 1: The relevant code parts are located inside a fixed sub-directory in your version control system.
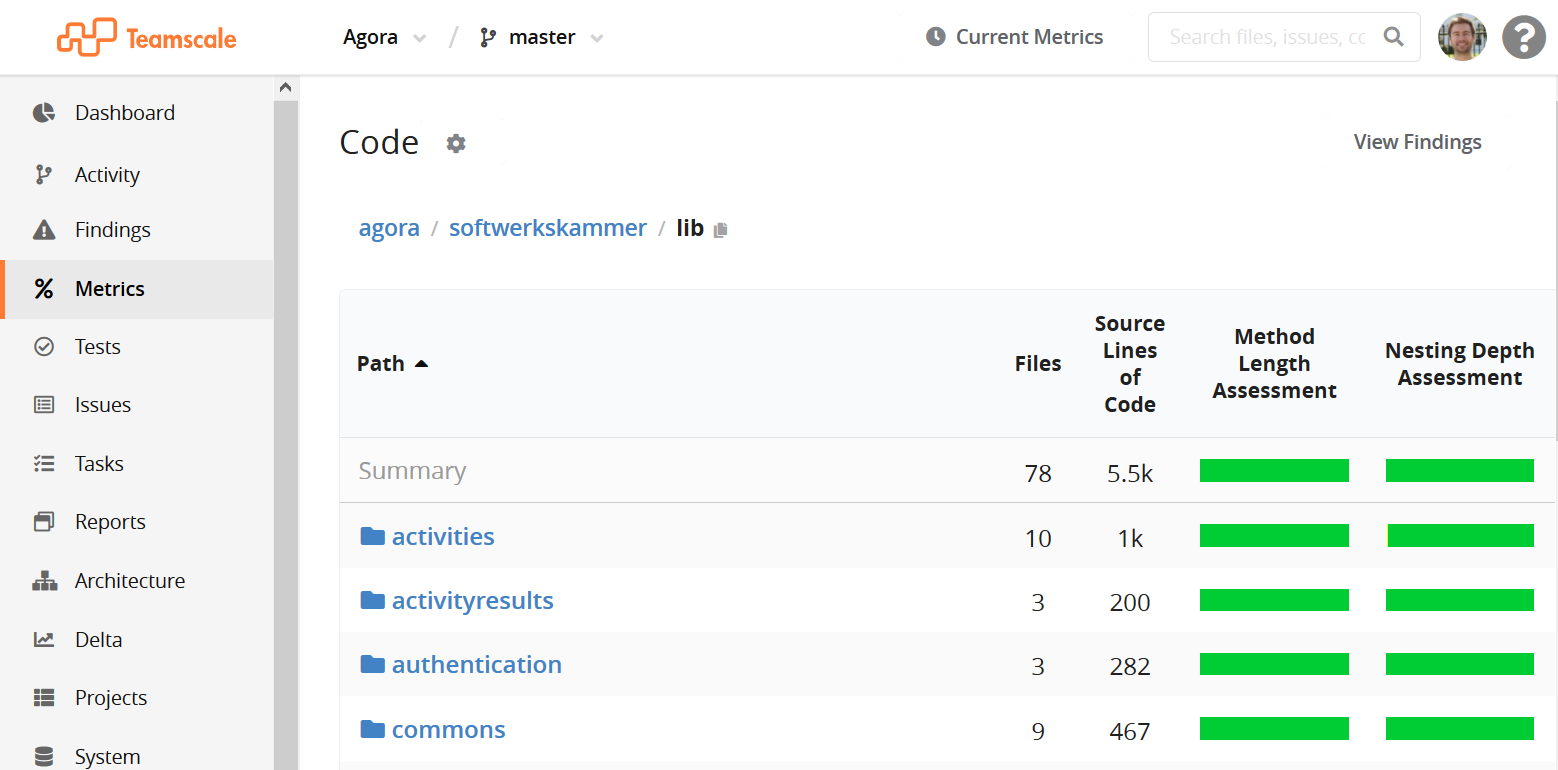
In this (simple) case, all relevant pages in Teamscale (Widgets, Findings, Metrics and Test Gaps perspective) can be configured to only show the data for the sub path you are interested in. Here is an example of the Metrics perspective showing information for a sub-path:
Case 2: The relevant code parts are spread in arbitrary folders inside your version control system
Using Teamscale's architectures, you can divide your code base into arbitrary parts, for example
- application vs test code
- server vs client code
- (potentially overlapping) team-specific code areas within one big project
- etc.
This works in addition to the regular file-based paths, and you can specify any number of architectures.
Once an architecture was configured, Teamscale will calculate all of its metrics for each of its parts (so-called "components").
Architecture Paths
As rule of thumb, you can select "architecture paths" wherever you can select regular paths in Teamscale.
Creating an Architecture
To create a new architecture in Teamscale, the following steps are needed:
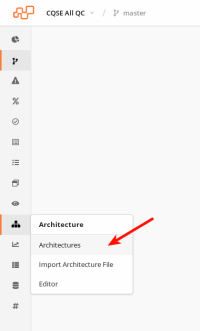
Go to the Architecture perspective
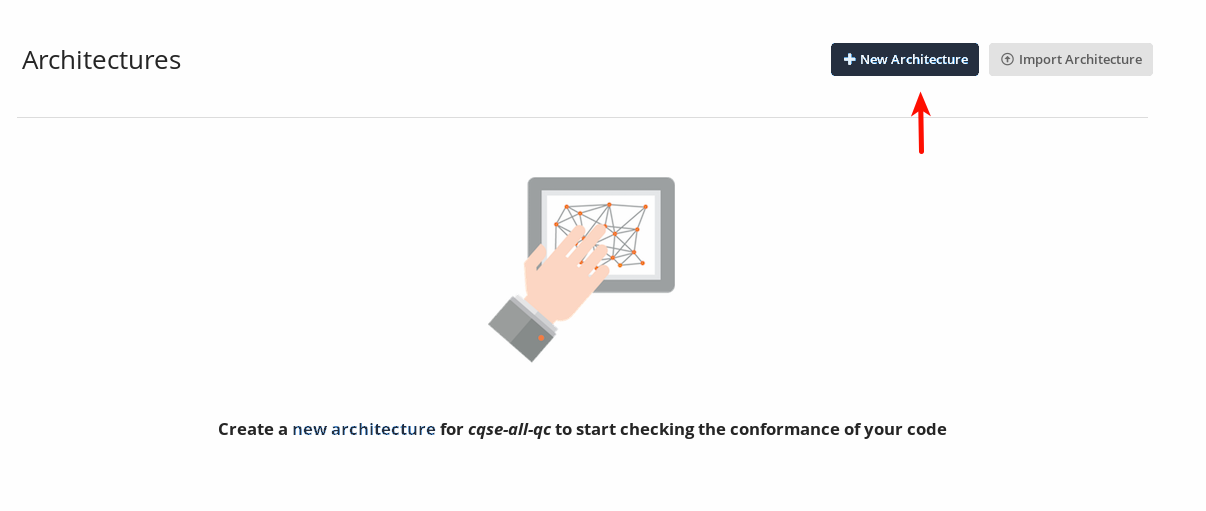
Create a new architecture. While these are usually used for our architecture conformance analysis, they can also be used to generate arbitrary views of your code.
In our case, we will create an architecture that separates test and application code.
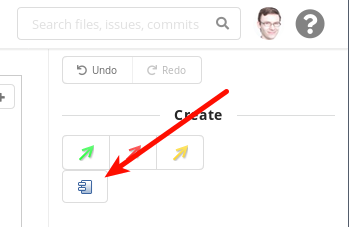
Create a new component for the application code by selecting the component tool and clicking on the white drawing area. A component groups code from your code base under a logical name. You can resize and move the component with your mouse and rename it later if you wish.
We'll choose "Application Code" for this example.
Click on the component.
In the lower half of the screen, create two new mappings as shown below. These mappings define which code to assign to the component.
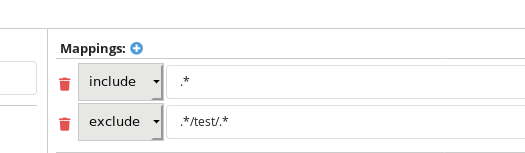
In our example, we include all code (
.*) and then exclude the test code (.*/test/.*). Adjust these patterns to the conventions used in your code base. You can add any number of exclude patterns.Pattern Format for Mappings
The syntax used for the component patterns is regular expressions, which offers flexibility.
Next, create a component for your test code, the same way as described above, then click on it.
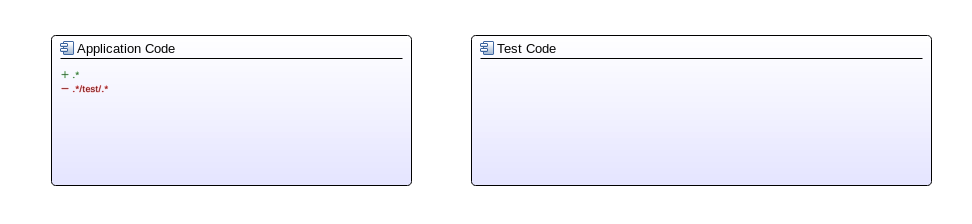
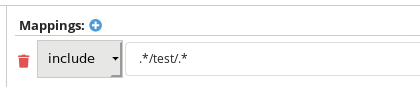
Add one or more include patterns that describe your test code. These should be the opposite of the patterns you used for the "Application Code" component.
Finally, change the settings in the lower left. As you don't want Teamscale to create findings for unmatched code ("orphans"), disable finding creation for the architecture.
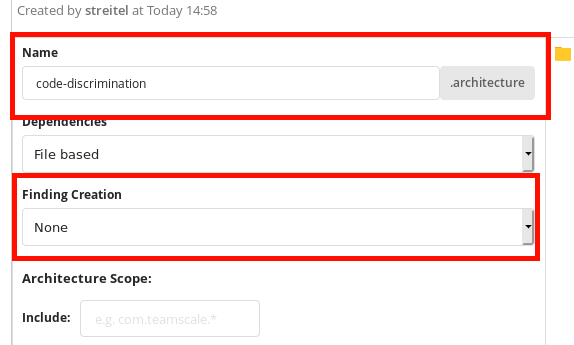
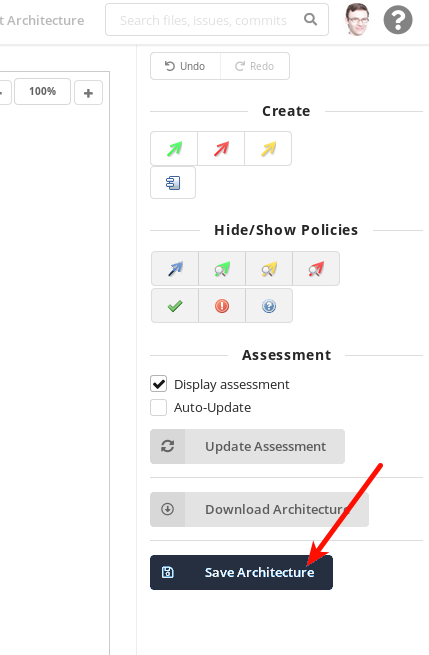
Save the architecture and give it a speaking name.
Architecture Name
The architecture name cannot be (easily) changed later.
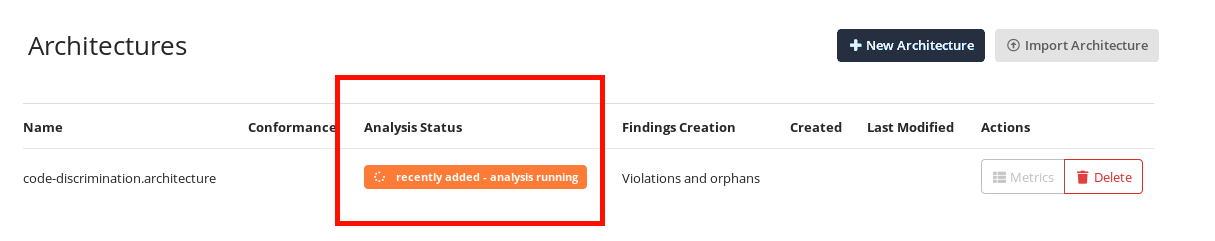
On the main page of the Architecture perspective, you will see your new architecture. Refresh the page until it has finished analyzing.
Viewing Data for a Specific Architecture
Once your architecture was stored and analyzed, you can view component-specific data by selecting the corresponding architecture path.
Example: Architecture Data in Metrics Perspective
In this example, we navigate to the Metrics perspective:
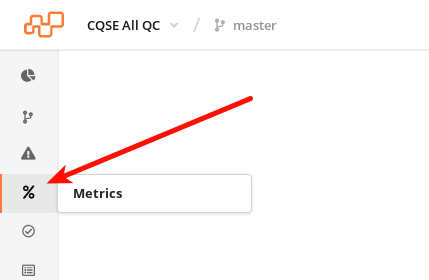
On the main page of the Metrics perspective, scroll down to the Architecture section:

You will find your architecture there. Click on it. This will list all the components you created for that architecture. For each component, you will see the aggregated metrics for the code you added to that component.
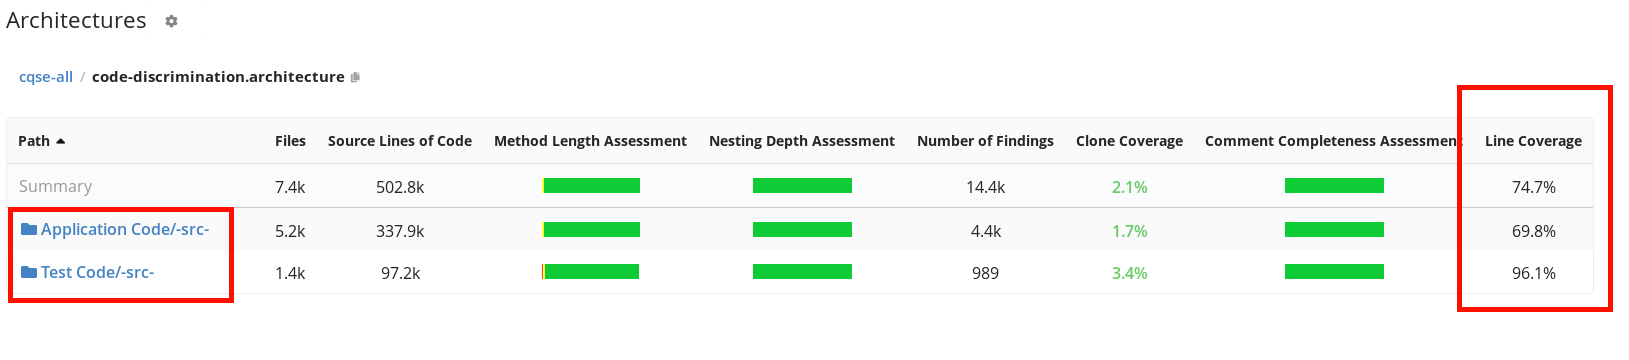
Clicking on a metric, e.g., Line Coverage, will give you more details. Clicking on a component's name will show you all the code that is included in it.
Example: In Dashboard Widgets
You can also view component-specific data in most dashboard widgets.
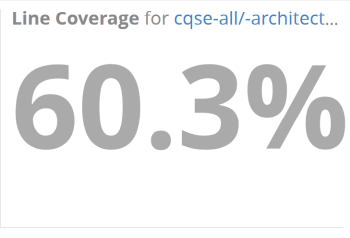
In this example, we would like to see the test coverage percentage for just your application code. To do this, we do the following:
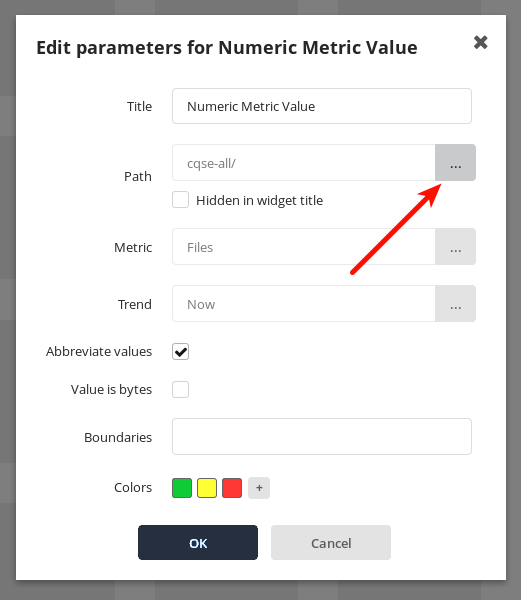
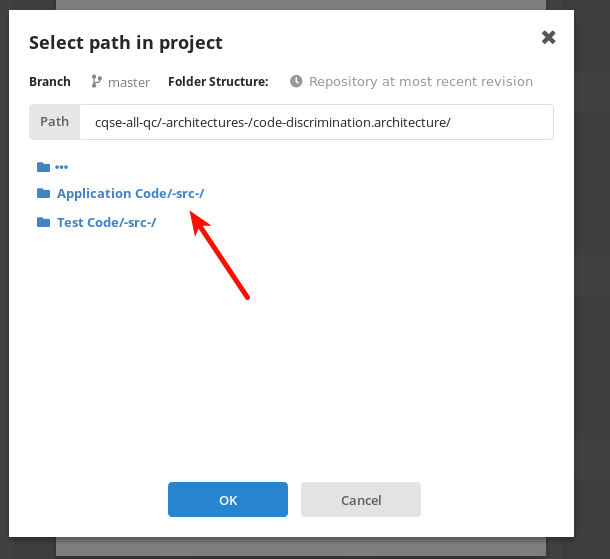
we create a Numeric Metric Value widget, edit it and open the Path selection dialog.
Select the artificial
-architectures-path.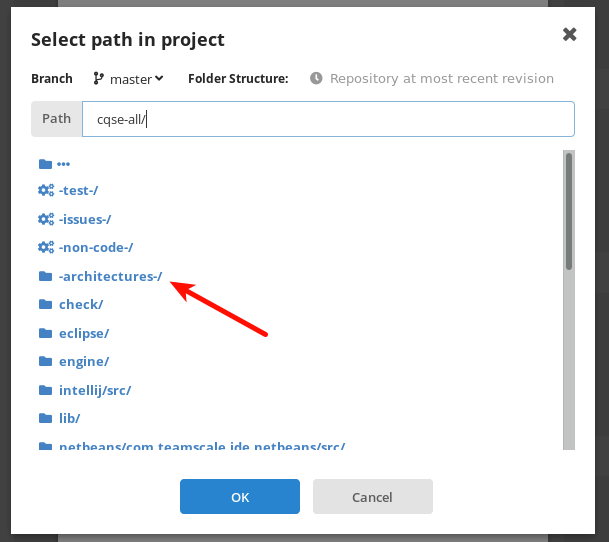
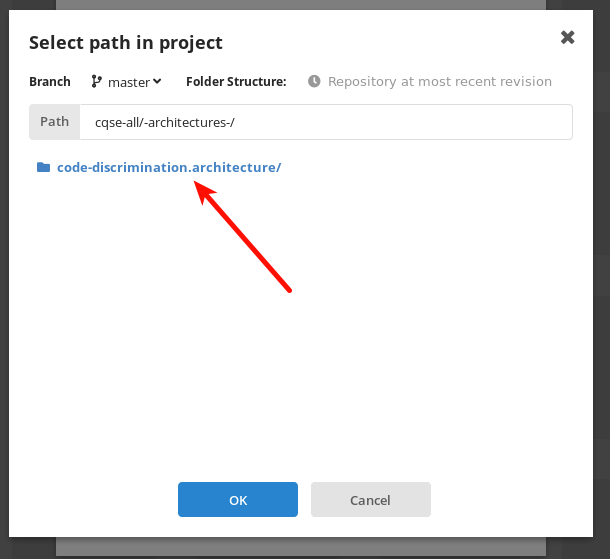
Select your architecture file.
Select the component for which you'd like to view the metric value (e.g., your application code).
Click OK and save your changes to the widget. This is the result: