Recording Test Coverage for Java with Docker
This how-to will show you how to set up test coverage recording for a dockerized Java application or any other language running on the Java Virtual Machine (JVM), so you can use the Test Gap analysis. This setup works for both automated and manual tests.
Kubernetes
For Kubernetes deployments, please follow our dedicated how-to.
The following graphic gives a quick overview over the final setup:
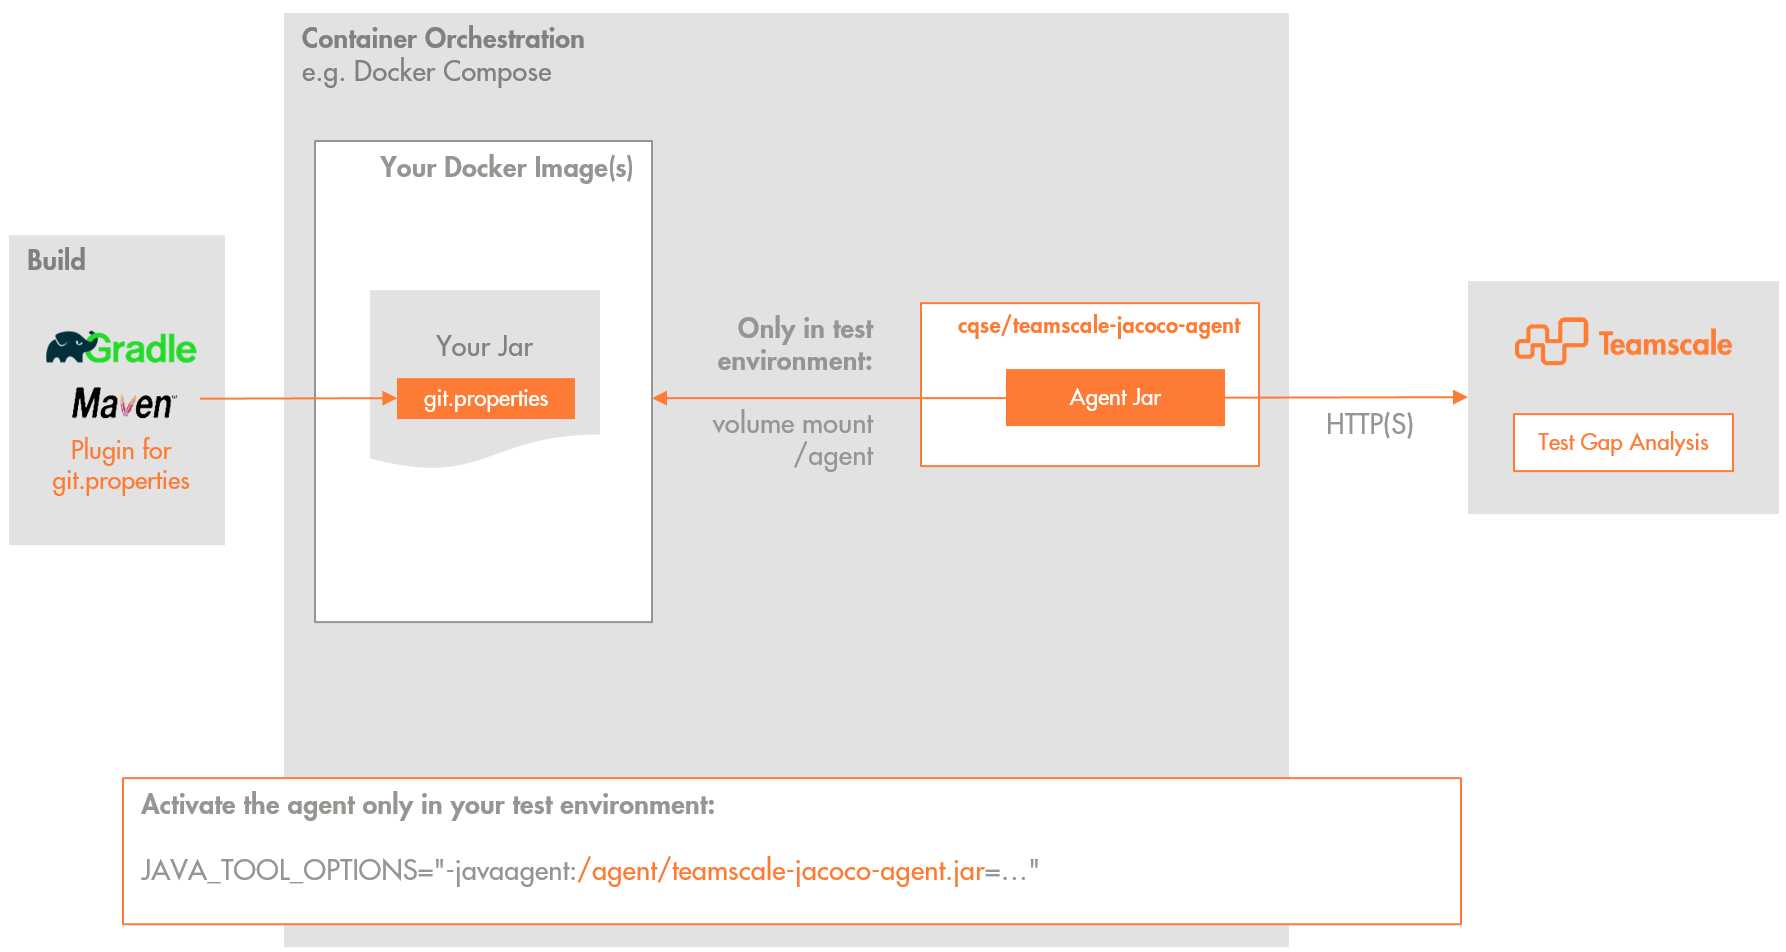
Coverage is recorded using the Teamscale Java Profiler, which is a Java profiler that can attach to any JVM to record the lines of code executed during any test (manual or automated). The profiler also handles the automatic upload of the recorded test coverage to Teamscale on shutdown of the JVM or in configurable time intervals.
Prerequisite: Generate git.properties
To upload the coverage to the correct commit in Teamscale, add a git.properties file to your jar/war. Depending on your environment there are multiple options:
Just add the following plugin to your build:
<build>
    <plugins>
		<plugin>
			<groupId>io.github.git-commit-id</groupId>
			<artifactId>git-commit-id-maven-plugin</artifactId>
			<version>9.0.1</version>
			<executions>
				<execution>
					<id>get-the-git-infos</id>
					<goals>
						<goal>revision</goal>
					</goals>
					<phase>initialize</phase>
				</execution>
			</executions>
			<configuration>
				<generateGitPropertiesFile>true</generateGitPropertiesFile>
			</configuration>
		</plugin>
    </plugins>
</build>
Now build and deploy your application.
Adjust Your Dockerfile
This step is necessary so all remaining coverage is uploaded when your application is shut down.
By default, the agent sends the coverage it collected when the JVM inside your Docker container is shut down. This requires that the JVM receives the SIGTERM signal sent by your orchestration tooling. Thus, you'll need to ensure that the JVM is the main process inside the docker image. This can be achieved by using exec to replace the shell process with your JVM process:
# this will not work:
CMD java -jar /your.jar

# use this instead:
CMD exec java -jar /your.jar
The same applies if you're using ENTRYPOINT instead of CMD:
# this will not work:
ENTRYPOINT java -jar /your.jar

# use this instead:
ENTRYPOINT exec java -jar /your.jar
If your application is wrapped inside a start script, you'll likewise need to ensure that you use exec to replace the shell process with the JVM process.
Testing if Your JVM Is the Main Process
To list all processes inside a running Docker container (e.g. named determined_dijkstra), run
docker container top determined_dijkstraIdentify the PID of your java process. Then run the following for your container to obtain the main PID of the container:
docker inspect -f '{{.State.Pid}}' determined_dijkstraYour java process's PID must be reported as the main PID by this command.
Set Up a Profiler Configuration
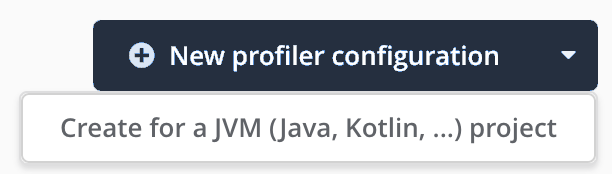
The profiler's configuration can be stored within Teamscale. This makes it easy to change and audit. To configure the profiler for your application, go to the Project Configuration > Coverage Profilers view. Open the dropdown of the New profiler configuration button and click on Create for a JVM (Java, Kotlin, ...) project.
You will be presented with a dialog that lets you generate a profiler configuration for a Teamscale project.
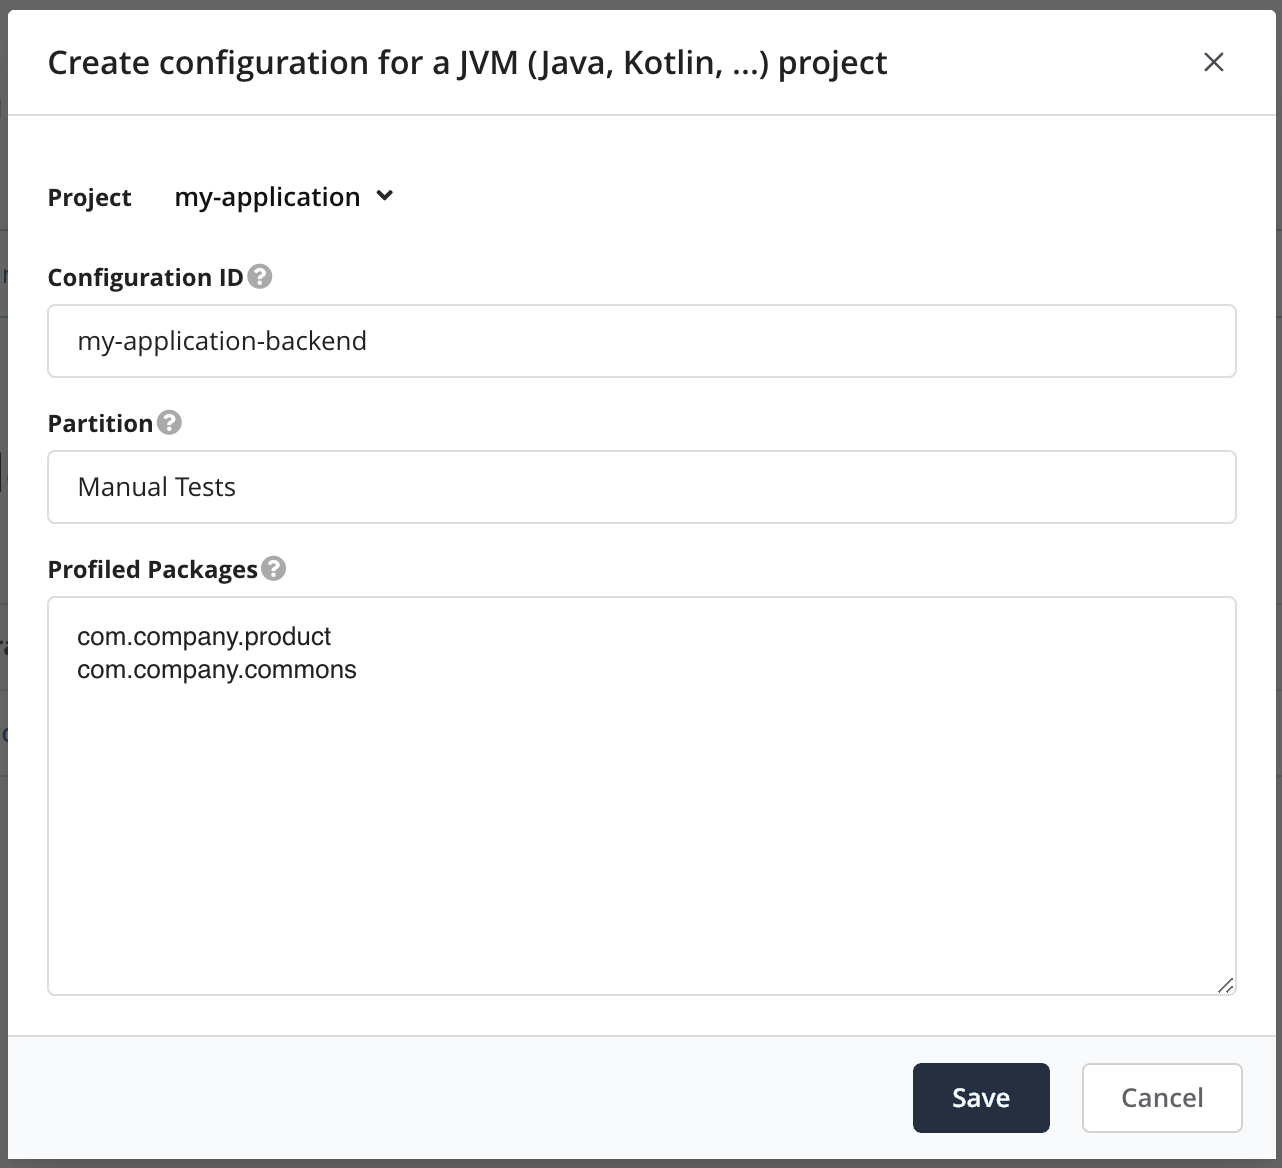
- Select the project that you want to collect coverage for.
- Choose a configuration ID. This ID will be used when starting the profiler so that it knows which configuration to use.
- Select a partition, which is a logical name that groups related coverage, e.g., the type of test that will be profiled (e.g., Manual Test, Unit Test, Regression Test).
- Select all packages that should be profiled. Subpackages are included as well.
Selecting Appropriate Packages
Teamscale automatically suggests packages to profile. Please review them carefully.
Please ensure the packages you select are "future-proof", i.e., they also match packages you might add in the future. This saves you time later, because you won't have to adjust the profiler configuration whenever you add new packages.
Make sure not to profile widespread packages that are also used by third-party software, e.g. net.java or com.
Finally, click Save.
The generated profiler configuration looks similar to the following:
includes=*com.company.product.*;*com.example.commons.*
teamscale-project=my-application
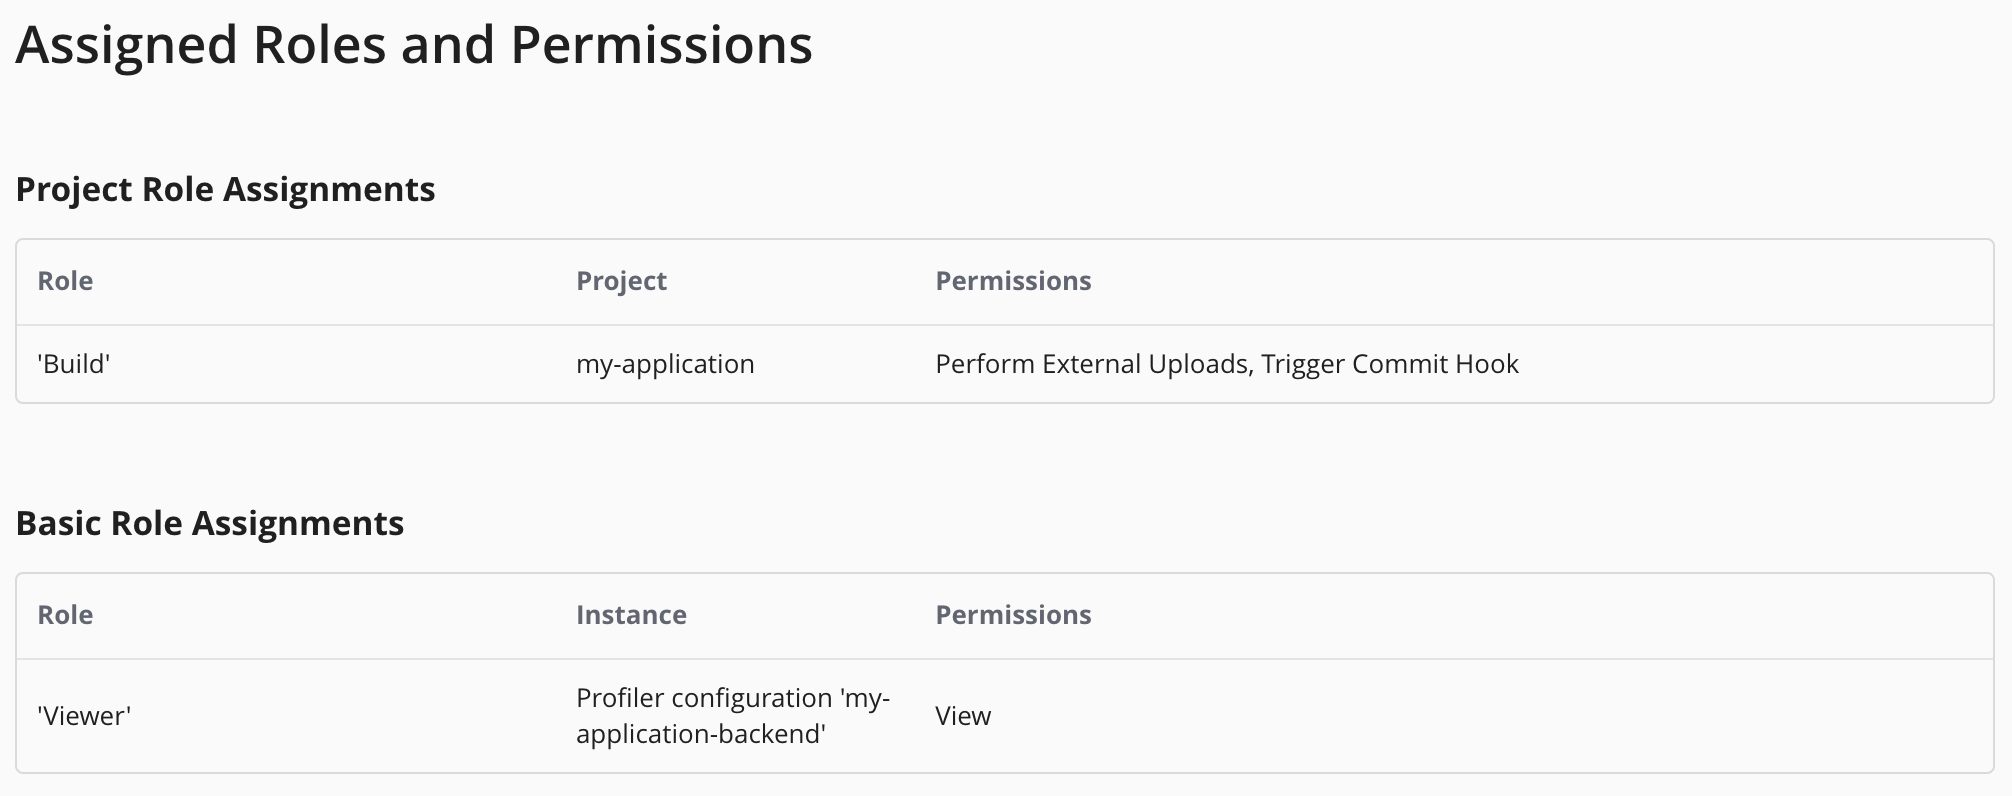
teamscale-partition=Manual TestsNext, please go back to the Project Configuration > Coverage Profilers overview. Click on the button next to the profiler configuration that you just created and assign Viewer permissions to the technical user that the profiler uses to connect to Teamscale.
Next, please go to Admin > Users and select the technical user whose credentials should be used for the coverage upload. Ensure that the user has the Perform External Uploads permission for the project. You can achieve this by assigning the pre-defined Build project role to the user.
Then generate an access key by clicking on Generate New Access Key and save it. We will need it in the next step.
Deploy the Profiler
You'll need to deploy the cqse/teamscale-java-profiler image next to your own Docker images. This image will do nothing by itself, it simply provides the profilers Jar file to your containers so you don't have to include the profiler in your images.
To make the profiler available to your JVM, you'll need to mount the /agent volume of the cqse/teamscale-java-profiler container into every Docker container for which you'd like to record coverage. This volume contains the profilers jar file.
Activate the Profiler
In order to put all parts together and activate the profiler for your application, you'll need to set the following environment variable:
JAVA_TOOL_OPTIONS="-javaagent:/agent/teamscale-jacoco-agent.jar=teamscale-server-url=https://your.teamscale.url,teamscale-user=your-build-user-name,teamscale-access-token=your-access-token,config-id=my-application-backend"Make sure to replace my-application-backend with the configuration ID you have chosen in the previous step and the connection details with your Teamscale URL and technical user and access token. If you are using an application server like WebSphere, JBoss, Wildfly etc. please have look at the specific instructions in the profilers documentation.
You'll need to set this environment variable in your Docker orchestration tooling (e.g. Docker Compose).
Now you can restart your container and the profiler will record coverage and upload it to Teamscale in regular intervals. You should also see the running profiler under Project Configuration > Coverage Profilers.
Debugging Setup Problems
The profiler by default logs to /tmp/teamscale-java-profiler-<PID>-<random string>/logs/ inside your Docker container. If the setup does not work as expected, please have a look at the problems reported in this log file, e.g., by running:
docker exec -it YOUR_CONTAINER_ID sh -c "cat /tmp/teamscale-java-profiler-*/logs/*"You can also make the profiler log debug information to stdout by appending ,debug=true to the JAVA_TOOL_OPTIONS.
Example: Docker Compose
# Add a volume that will hold the profiler files.
# It can be shared between profiler's and your app's container.
volumes:
  teamscale-java-profiler:

services:
  # On start, the container will copy the profiler files to /transfer,
  # which is mounted to the previously defined volume, and exit.
  teamscale-java-profiler:
    image: cqse/teamscale-java-profiler:latest
    volumes:
      - teamscale-java-profiler:/transfer:rw

  yourapp:
    image: your/image
    # Wait for the profiler container to have copied the profiler jar
    depends_on:
      teamscale-java-profiler:
        condition: service_completed_successfully
    # Use the profiler's volume.
    volumes:
      - teamscale-java-profiler:/teamscale-java-profiler:ro
    environment:
      # Enable the profiler.
      # Replace with your Teamscale instance's URL, username and access token
      JAVA_TOOL_OPTIONS: "-javaagent:/teamscale-java-profiler/teamscale-jacoco-agent.jar=teamscale-server-url=https://your.teamscale.url,teamscale-user=your-build-user-name,teamscale-access-token=your-access-token"
      # set the profiler configuration ID from the previous step
      TEAMSCALE_JAVA_PROFILER_CONFIG_ID: "my-application-backend"
Podman Compose: depends_on Not Reliably Enforced
If you are using Podman or Podman Compose, there is a known Podman bug where depends_on with condition: service_completed_successfully is not always respected. This can cause your application to start before the profiler container has finished copying its files, preventing the profiler from attaching.
As a workaround, please start the profiler container separately first and remove the depends_on block from your application service.