Getting Started
We are happy that you want to give Teamscale a try! On this page, you can find guides helping you to get started with Teamscale and its analyses. If you don't know yet which analysis is relevant for you, you can find some guidance on our website.
Once you are ready to get some hands-on experience, you can start with Installing Teamscale and Setting Up Your First Project which you'll need for all analyses.
Feel free to contact evaluation@teamscale.com at any time with questions or problems!
Organizational Best Practices for a Quick and Successful Start
Our experiences show that new tools should always be introduced step by step. Many of our customers started with a single system and expanded afterwards. Good rules of thumb for a successful evaluation are:
- Start with a small, controlled system or even parts of a system.
- Do not start with the most difficult technology.
- Choose a system whose team is eager to try new approaches.
- Strive for a quick proof of concept.
Installing Teamscale and Setting Up Your First Project
To try out Teamscale, the first step is of course to set up a Teamscale server. You can host Teamscale on-premise, or you can use the Teamscale cloud. Every Teamscale license includes cloud hosting for free, so you can concentrate on your code instead of running the tools.
Once you have your instance, create your first project. For an overview how to navigate Teamscale, have a look at the general UI features. Now that you know the basics, skip to the section for the analysis you are interested in below.
Improving Code Quality with Static Code Analysis
Static code analysis (SCA) in Teamscale is the most straightforward analysis to set up. You've already done all the basics by setting up an analysis profile and a project. The checks you defined in your analysis profile ran during the initial analysis phase and the results are already available in Teamscale's web UI. For example, you will see them mainly in the Activity, Findings and Metrics perspectives (continue reading here before diving deeper into the individual perspectives).
In this section, we'll show how you can integrate the results of Teamscale's SCA in the tools and processes you are already using in order to use the results effectively, especially since Teamscale works differently compared to other tools on the market. Teamscale does not analyze the whole codebase in batch (c.f. How (Not) To Control Quality) but every single commit incrementally. This enables faster and more personalized feedback, as you can see which problems were newly introduced on a commit level (c.f. Why Fast Feedback is Essential).
At this point, we propose three feedback loops to integrate the analysis results in your development processes and tools: 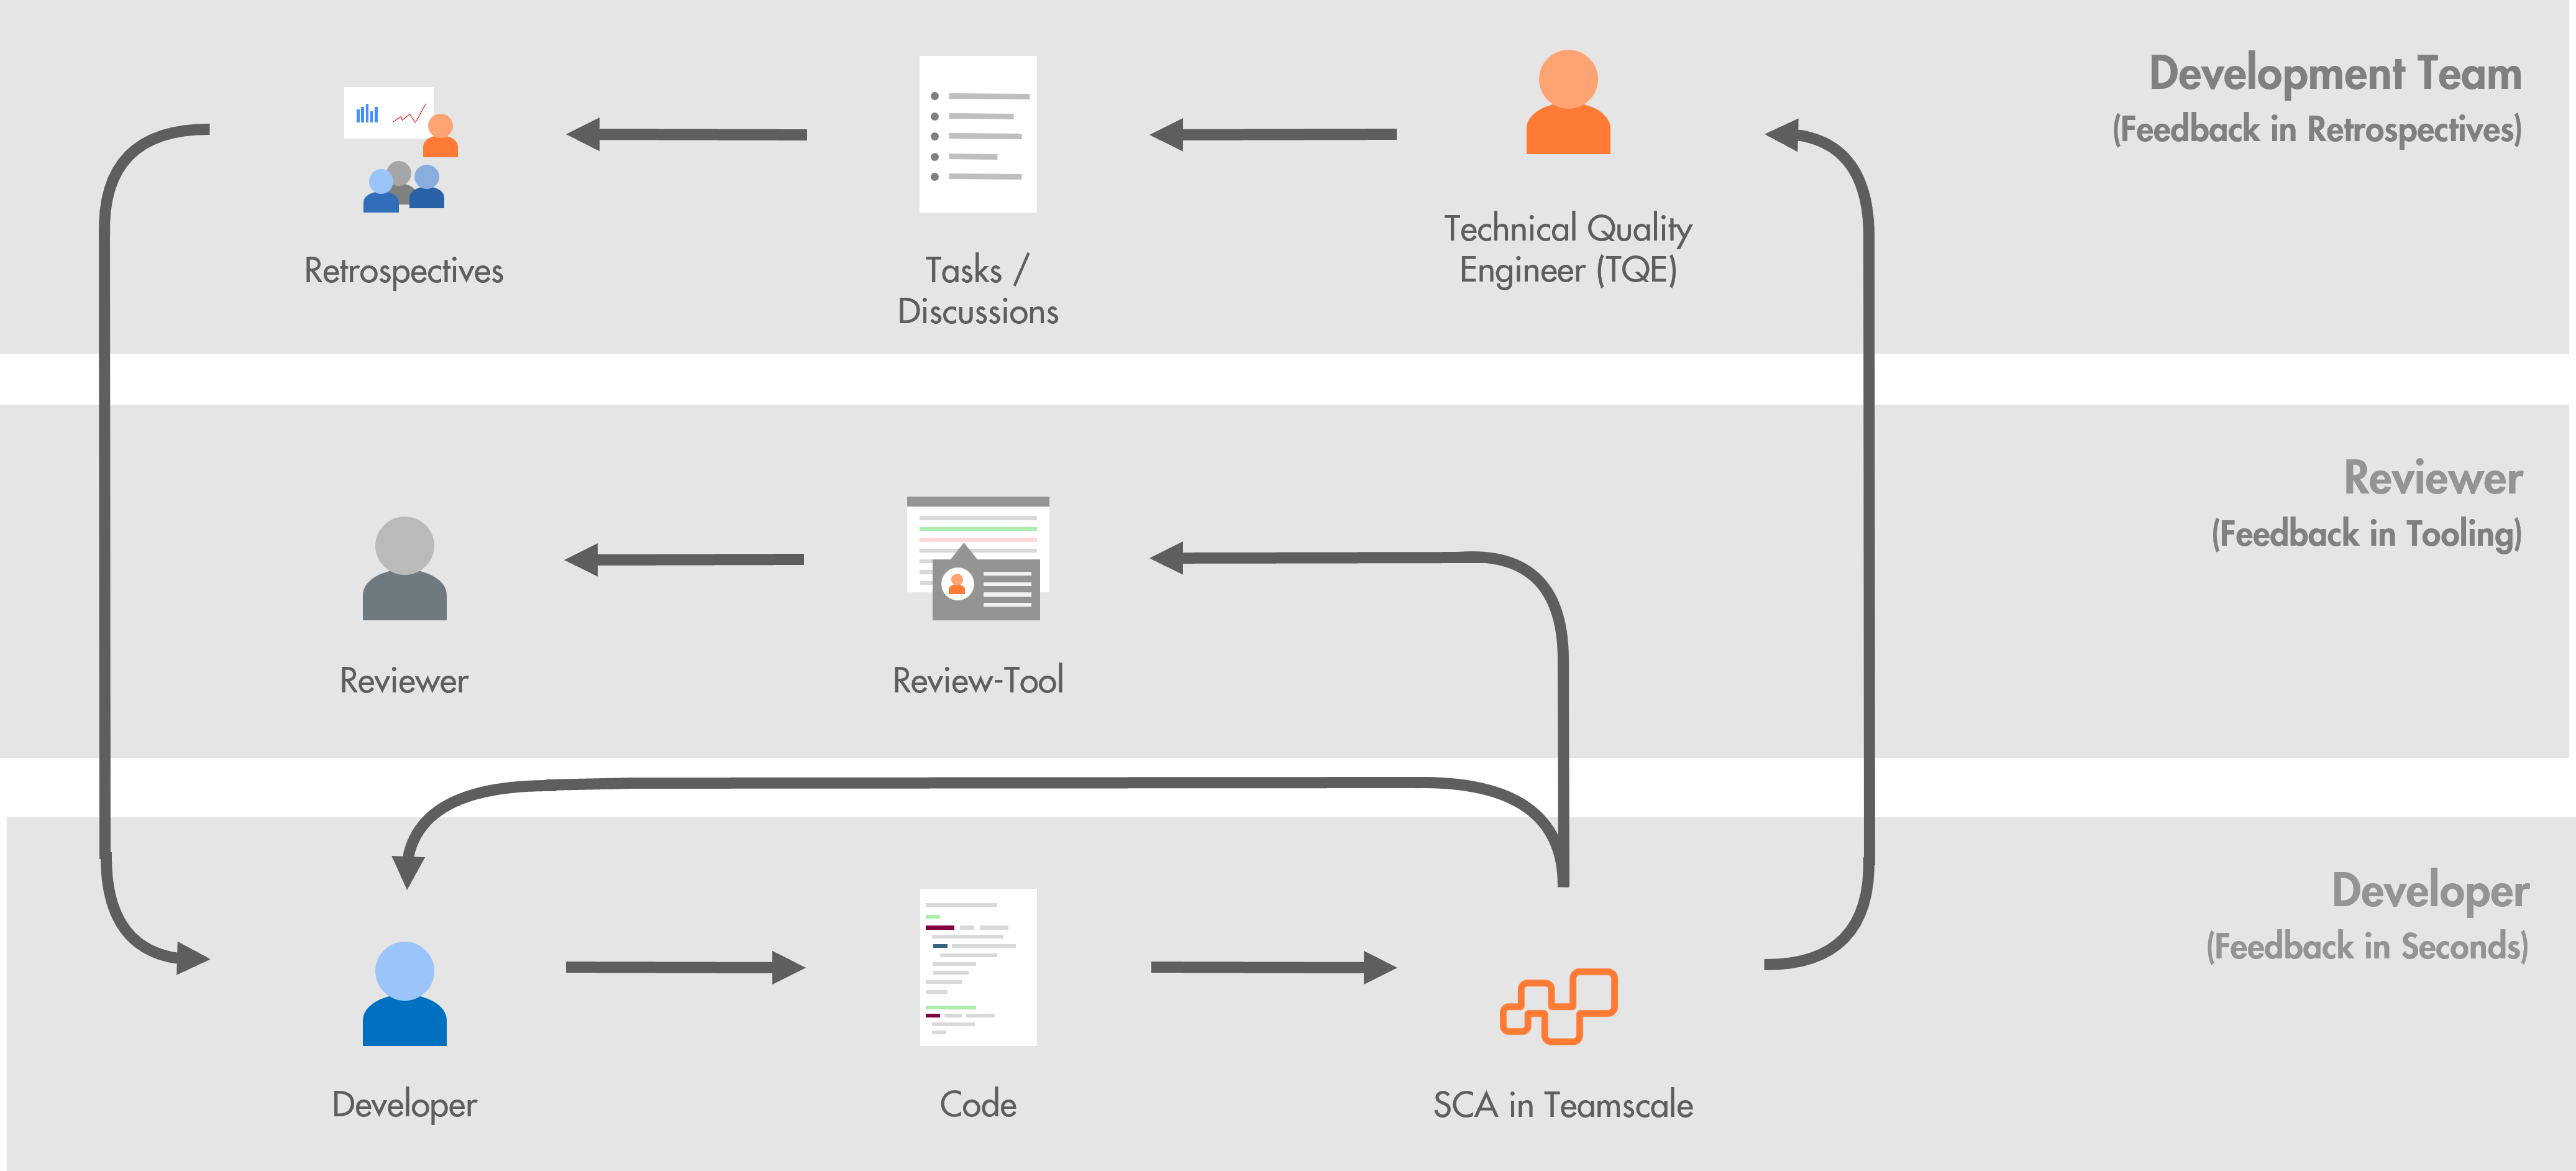
Developer feedback: The incremental analysis of Teamscale creates results for each new code commit. You can see them in the Teamscale web UI (e.g. in the Activity or Findings perspectives) within seconds after pushing the code changes. In addition, you can use Teamscale's IDE integration, so that developers see problems even before committing their changes directly in their IDE.
Reviewer feedback: Teamscale can also integrate in your existing review tools and workflows to provide additional support in doing professional and tool-supported reviews. For example, you can also integrate the analyses' results into your
- your pull/merge requests and
- your Jira Issues, so that the review can keep an eye on the newly introduced findings for a feature or bug fix before merging the changes back to the main branch.
Development Team Feedback: Teamscale also provides features for analyzing quality trends for configurable time periods in order to support development teams in tracking their code quality over time. For example, you can create quality dashboards for your projects to monitor and assess quality evolution. In order to establish a continuous quality control process, you can also create quality reports to store artifacts to discuss, e.g. in the scope of a recurring team (quality) retrospective.
Go ahead and set up the integrations you are interested in right away.
Once finished, you may want to learn
- about our best practices on how to use SCA to achieve lasting improvements in code quality over time.
- about improving software quality with Teamscale in general to get an overview
- about Architecture Analysis
- about supported technologies
- about Tasks in Teamscale
Improving Test Quality with Test Gap Analysis
If you don't yet know what Test Gap Analysis (TGA) is, read how you can use it to improve test quality or watch our workshop in English or German.
TGA needs the code changes from your version control system and test coverage from your test environments to determine which changed code has not been tested yet.
To get the changes, the only thing Teamscale needs is a connection to your repository. You've already done that when you set up your first project.
For the test coverage, you can upload your existing test coverage if you are already collecting it for your tests. Alternatively, you can learn how to collect coverage for your programming language and even for manual tests. If you want to follow a step-by-step guide with an example project, you can use our tutorials for Java and C#
Once you set up both the connection to the version control system and the upload of the test coverage you can learn how to interpret the results of TGA efficiently and how to create a TGA dashboard. You can also learn how to analyze Test Gaps aggregated by issues.
To get feedback on your tests in the tools you are already using, learn how to integrate the results of Test Gap Analysis in your Jira tickets.
Dealing with Long Running Test Suites with Test Suggestions
If you don't yet know what test suggestions are, read how you can use them to get fast feedback despite long-running test suites or watch our workshop in English or German.
Teamscale supports three different approaches for test suggestions. The easiest to get started with is Similarity Scoring as it only requires that you include your test code in your Teamscale project. We recommend you start with Similarity Scoring.
The other two approaches, Test Impact Analysis (TIA) and Pareto Optimization are more advanced. They require additional data to generate better results: You first need to record for each test, which areas of the code it covers. That's what we call testwise coverage. Learn how to record testwise coverage for any programming language.
Learn how to use TIA and Pareto in our tutorial.
Connecting Requirements with Code and Tests using Requirements Tracing
Learn how to use Requirements Tracing to connect the requirements to their implementation and tests in order to figure out, for example, whether your requirements are verified correctly by your tests.
Learn how to set it up in our tutorial.