Setting up Requirements Tracing Analysis
As a person responsible for making sure that safety-critical requirements are correctly implemented and tested in your software system, you may want to use the Requirements Tracing features of Teamscale to support you. This tutorial leads you through the setup of major requirement tracing features available in Teamscale and consists of the following parts:
Step 1: Preparing the source code for analysis
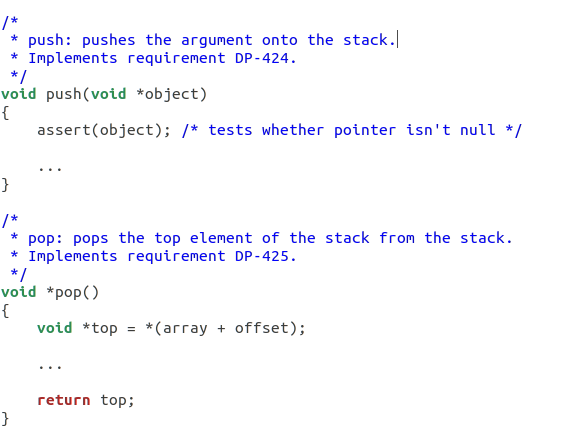
Clone the GitHub repository The Algorithms - C. This is an open source implementation of common computer science algorithms in the C language. We will use it as an example of a safety-critical system under development. Navigate to data_structures/stack/stack.c file of the repository and add a couple of source code comments that reference spec items, as shown in the image below. Let us assume that all the spec items in your requirements management tool adhere to the naming scheme DP-(\d+), e.g., DP-123. Adding the references to source code comments allows Teamscale to establish links between the code entities (methods, classes, etc.) and the corresponding items imported from the requirements management tool.
Commit your changes.
Step 2: Setting up a Teamscale project with a Requirements Management Tool connector
As a prerequisite for this step, create a free test account in the public Polarion instance. We will use the System Requirement Specification of the drivepilot project as an example of a requirements specification for a safety-critical software system under development.
In Teamscale, go to Project Configuration and click New project.
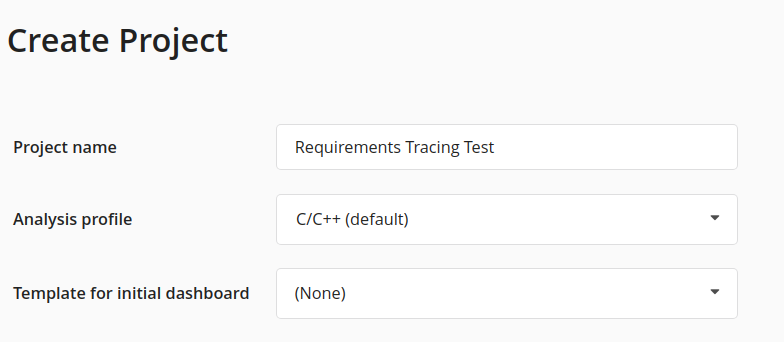
Name the new project Requirements Tracing Test and choose the analysis profile C/C++ Default.
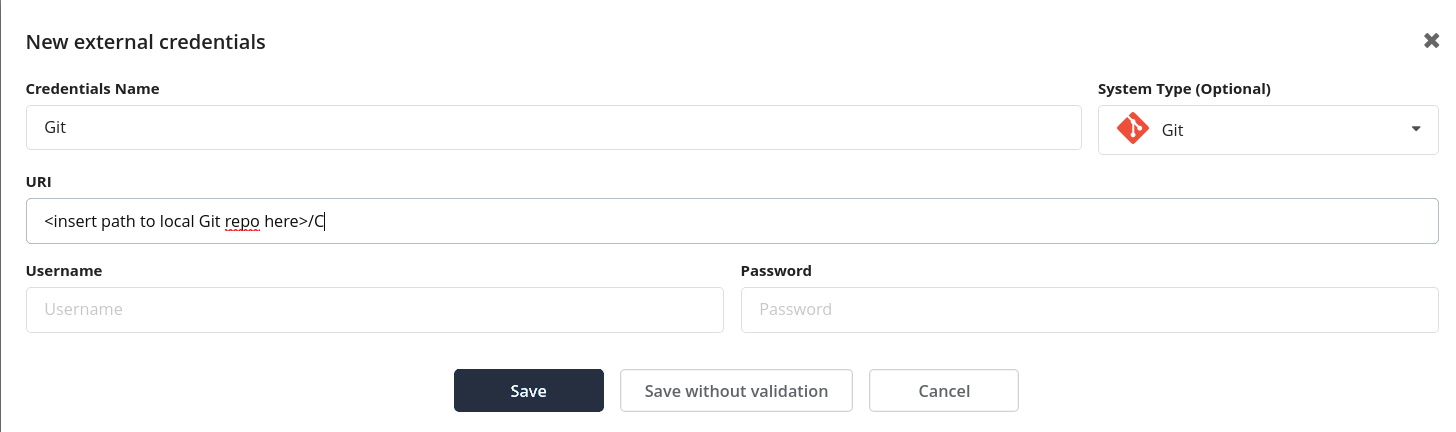
Click Source Code Repository and select Git. Create a new account named Git and point it to your local copy of the repository that we have modified in Step 1. Leave the rest of the options unchanged.
Click Requirements Management Tools and select Polarion. After that, point the Teamscale connector to the Polarion account you have created using the https://almdemo.polarion.com/ URL and your username and password.
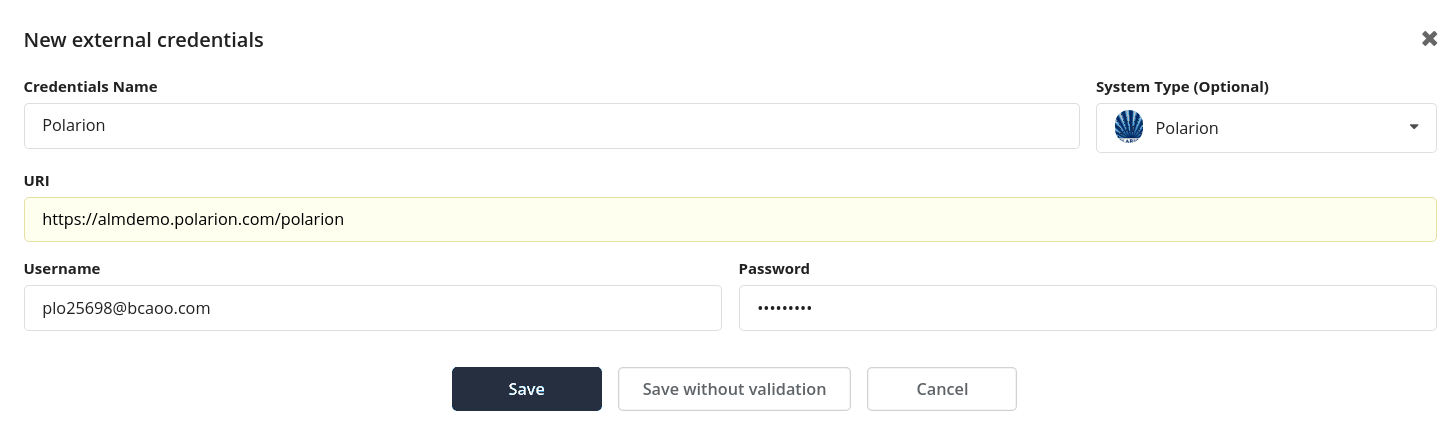
Configure the connector as shown in the image below.
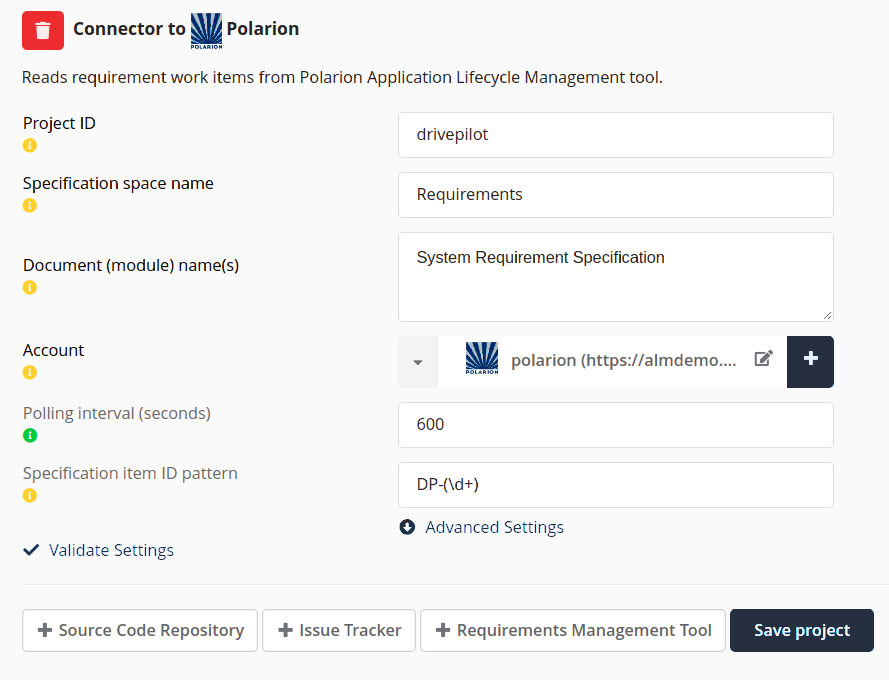
Note that we need to provide Teamscale with a way to identify the work items that belong to the Teamscale project. This is done via the Spec item ID pattern option. This is the reason why we have provided the source code comments of the shape DP-{\d+} - the example drivepilot project in the Polarion instance uses this naming schema for the work items.
Click Create Project.
Step 3: Getting to know the Requirements Tracing Perspective
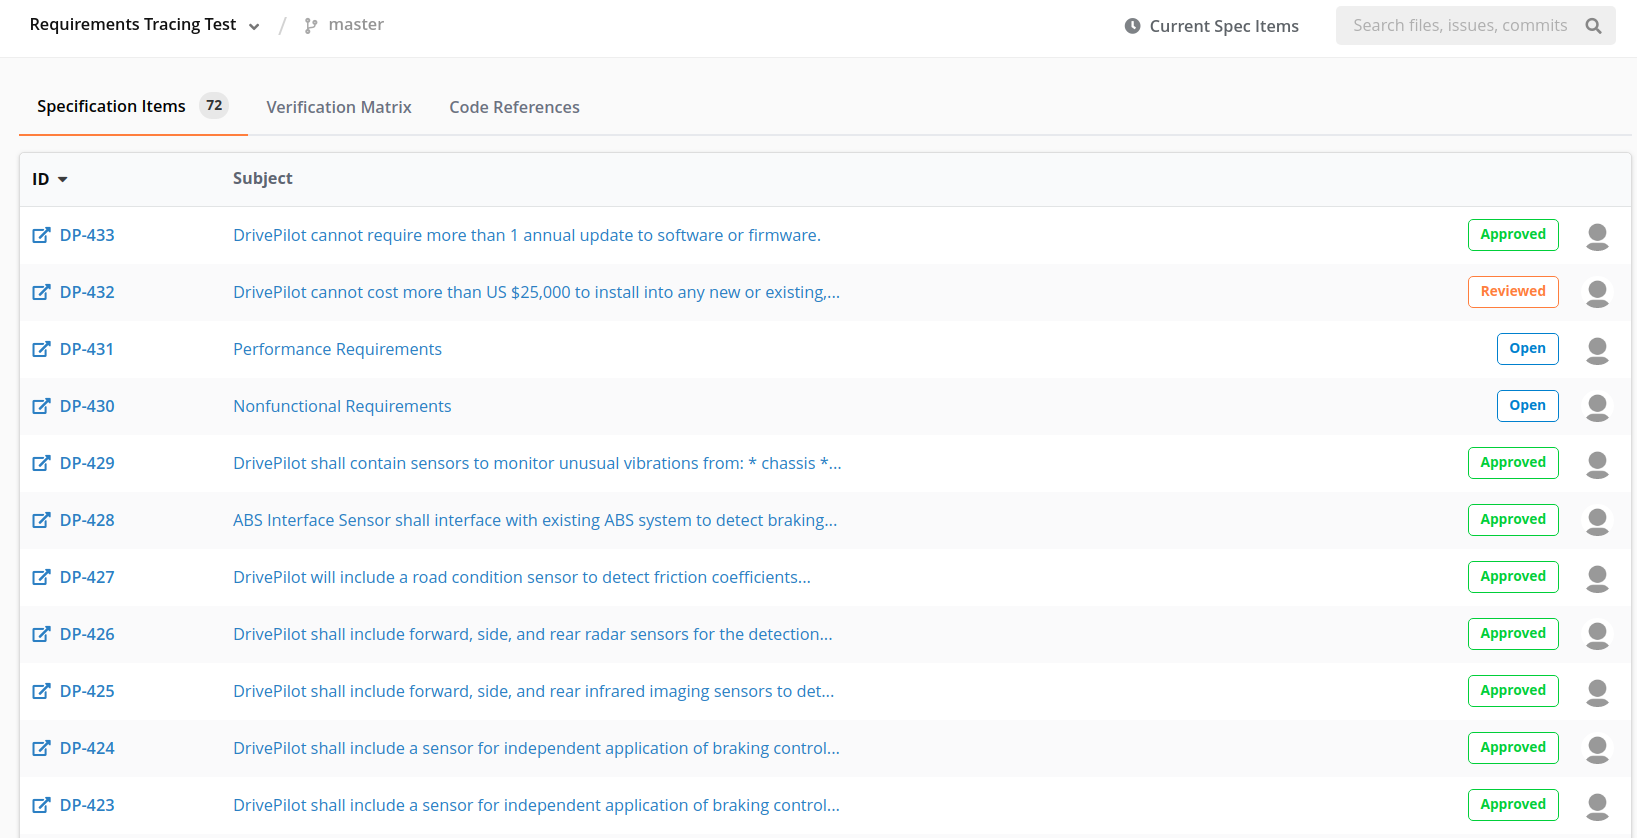
Navigate to the Requirements Tracing Perspective in Teamscale and view the spec items.
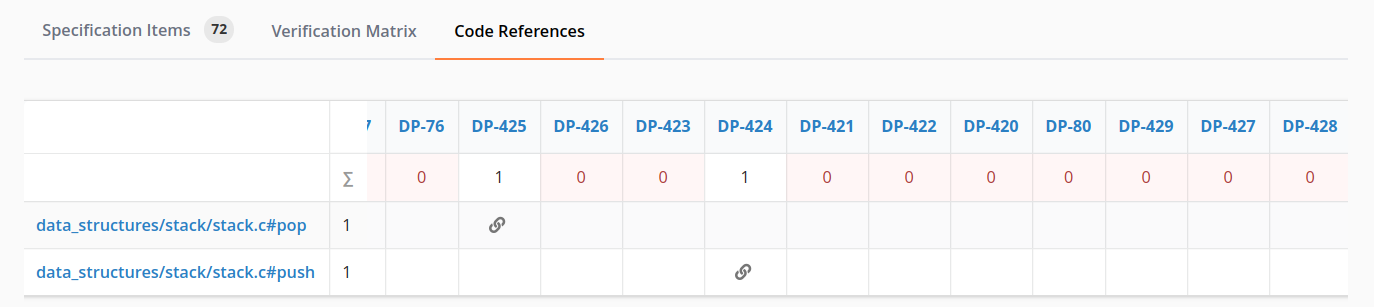
The code reference matrix in the next tab tells you exactly which spec item is referenced by which method/class in the source code.
Step 4: Using spec item metrics in Dashboards
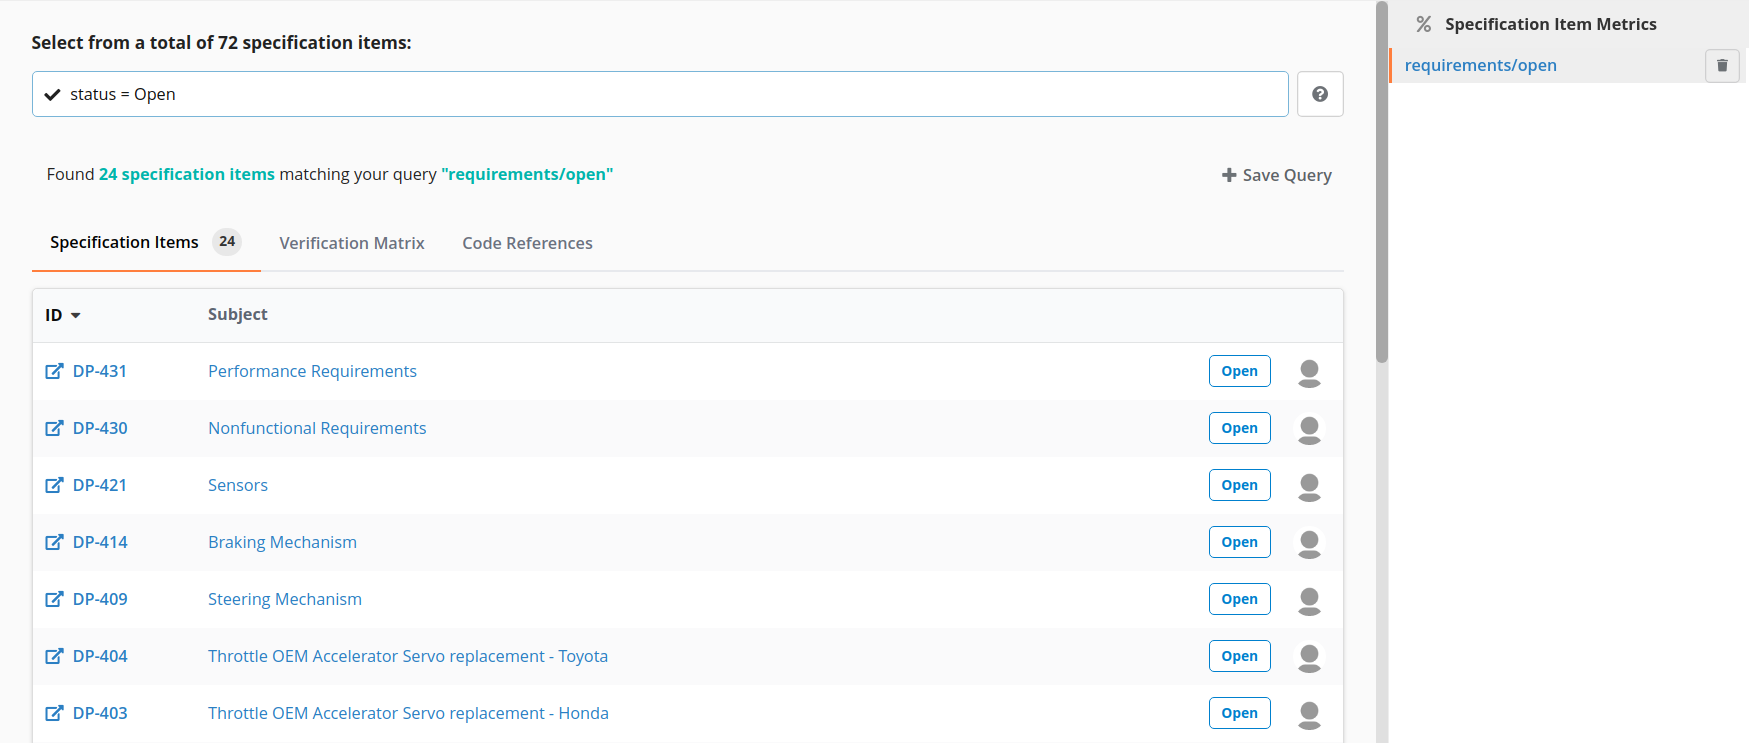
Create and save a spec item query. In the image below, the query is status=Open, which means it selects all the spec items in status Open.
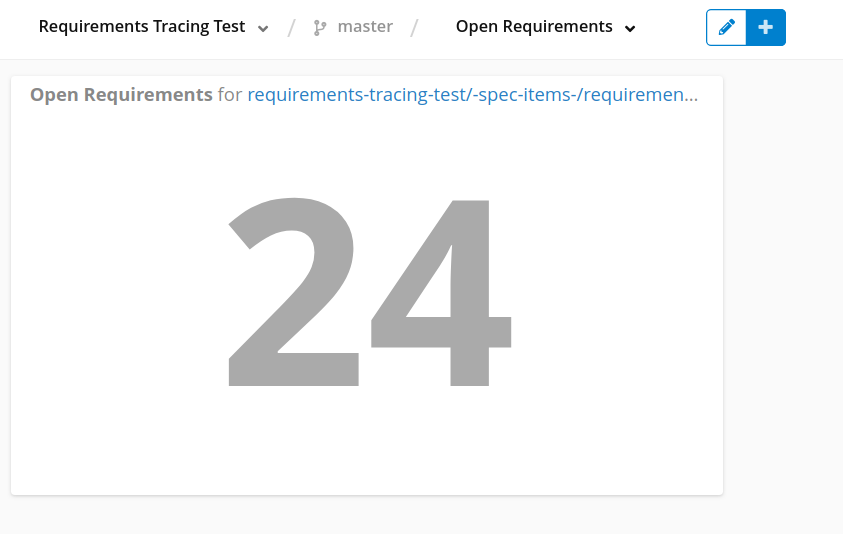
Navigate to the Dashboards perspective and create a metric widget, such as the numeric metric widget in the example below. Select requirements-tracing-test/-spec-items-/requirements/open as Path and Spec Items as Metric in the widget configuration. The example widget shows the count of requirement items in the state Open.
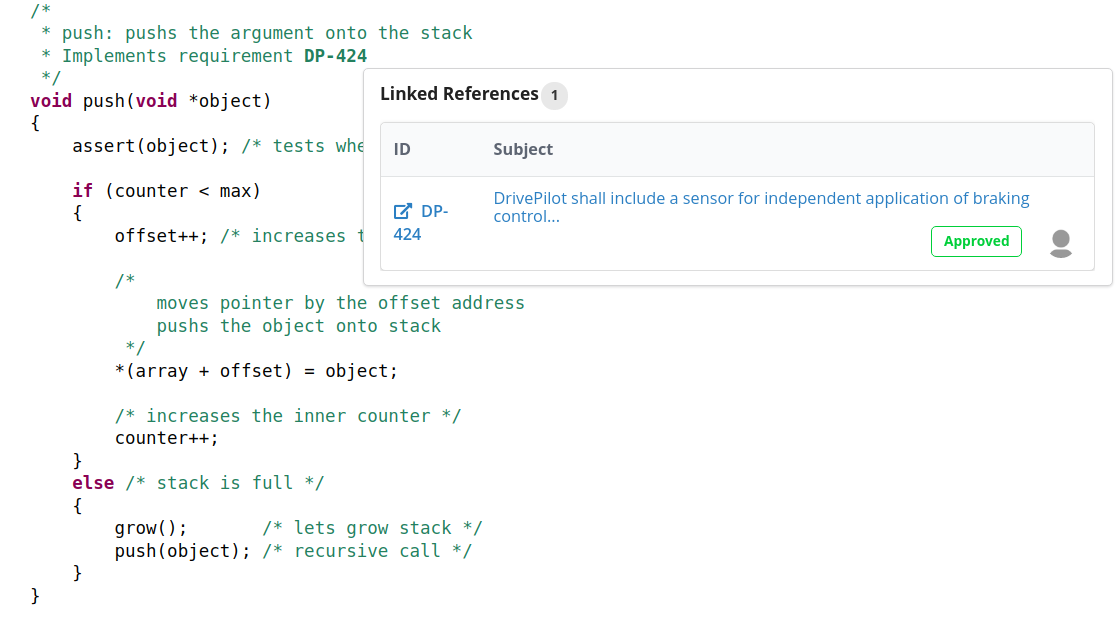
Step 5: Linking the references in source code to the spec items from your requirements management tool
Navigate to the Metrics/Files View of Teamscale and then to the data_structures/stack/stack.c file. View how the spec item references you have provided in the source code in Step 1 have been linked to the spec items from your requirements management tool.