Test Gaps Perspective
The Test Gaps perspective assists you in assessing the quality of your tests. In particular, it is possible to detect potential test holes using the test gap analysis, which focuses on code that has been untested after its latest modification. You can also view the results of test executions to check for failing tests.
Action: Configuring Teamscale for Test Gap Analysis
Generally, the Test Gap Analysis combines static information (from the code repository) and dynamic information (code coverage from test executions measured by a profiler such as JaCoCo). Whereas the static part comes out-of-the-box for every Teamscale project, the test coverage has to be uploaded to Teamscale as a separate step.
For testing purposes, this can also be done manually via the Upload Report feature, as described here.
Actual changes vs. refactorings
For detecting actual test holes, only non-trivial changes of the code are considered as »changes«. Otherwise, simple refactorings like variable renamings will falsely mark a code fragment as »untested«, even though the changes preserved the original semantics of the code.
Test Gap Overview
A test gap is a code region that has remained untested after its latest modification.
Once test coverage was uploaded to Teamscale, the Test Gap Overview serves as main entry point of the Test Gaps perspective. It shows an overview of the testing-related metrics of the root level of the repository, as well as for each architecture configured in Teamscale. These metrics are:
Test Gap Shows which shares of the code are unchanged (gray), changed & tested (green), changed & untested (yellow), and new & untested (red).
# Test Gaps the total number of test gaps.
Execution Visualizes which percentages of the code have been executed (green) and which have not been executed (gray) by the tests.
Churn Shows the parts of the system that were changed or added, while disregarding all coverage information.
The metric descriptions are also available as tooltip of the corresponding header table cell.
If the Test Gaps tab is selected, you can see the following UI components in addition to the table:
Baseline Defines the beginning of the time frame for which code changes should be counted (e.g., since the last release). The default is 30 days in the past.
Coverage sources Lets you choose which test partitions to consider for the coverage. As default, all partitions are selected. You can also select other Teamscale projects as coverage sources (cross-annotation). In that case, coverage is collected across all branches and partitions: a method is considered covered if it's covered in any of the current project's selected partitions or in a selected cross-annotation project (across any branch/partition), provided the method's code is identical.
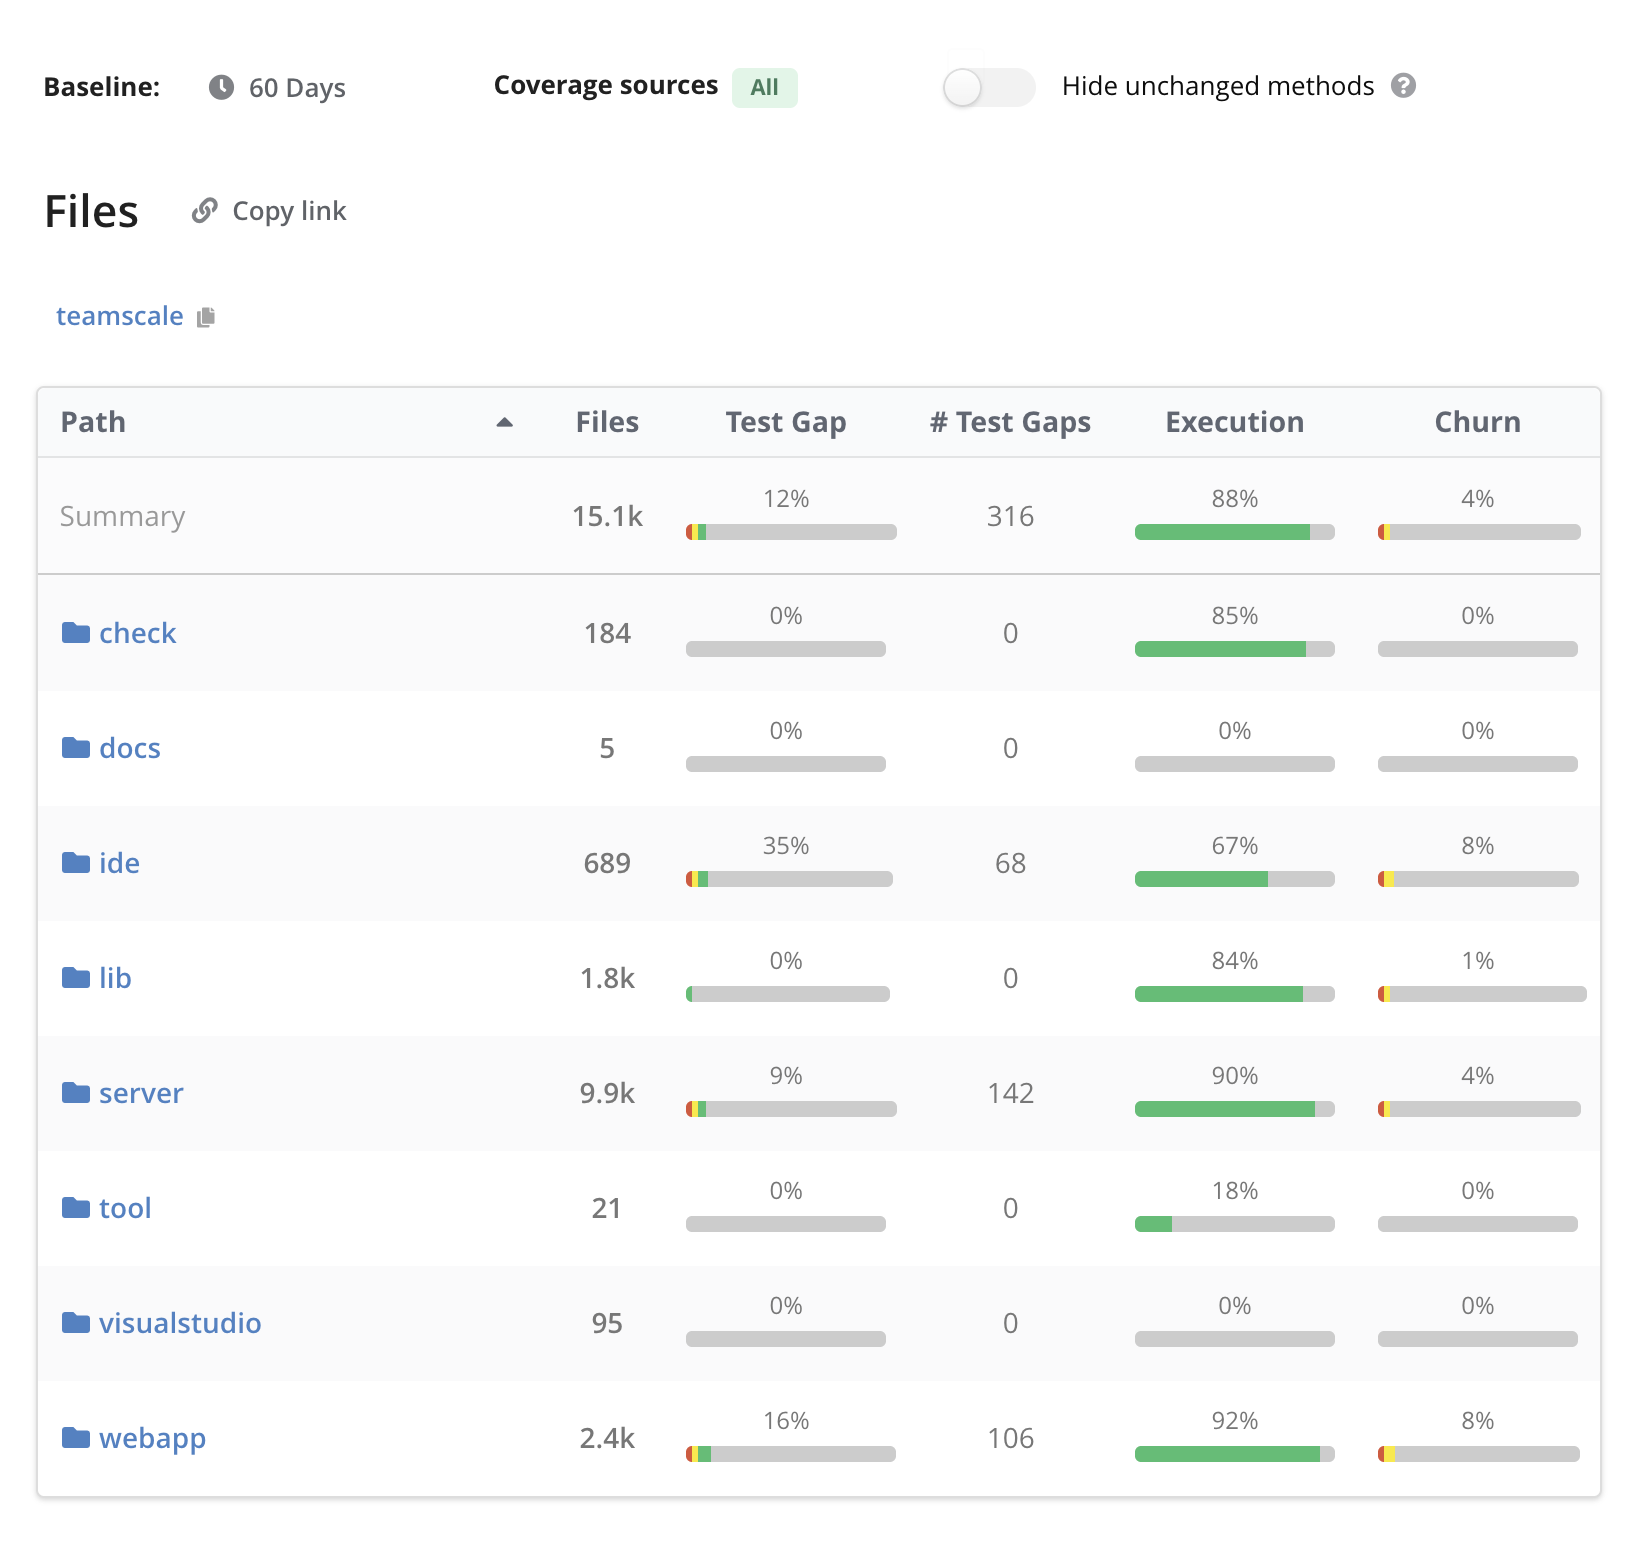
Files View
The Files view lets you navigate into individual folders and files while showing aggregated test-gap metrics. Similarly, the Architecture and Code Scopes views allow you to look at the files based on the structure of an architecture or based on your defined Code Scopes. The summary row of the table contains the aggregated values for all the shown folders and files. A click on one of the table cells will open an overview of the contents of the corresponding path:
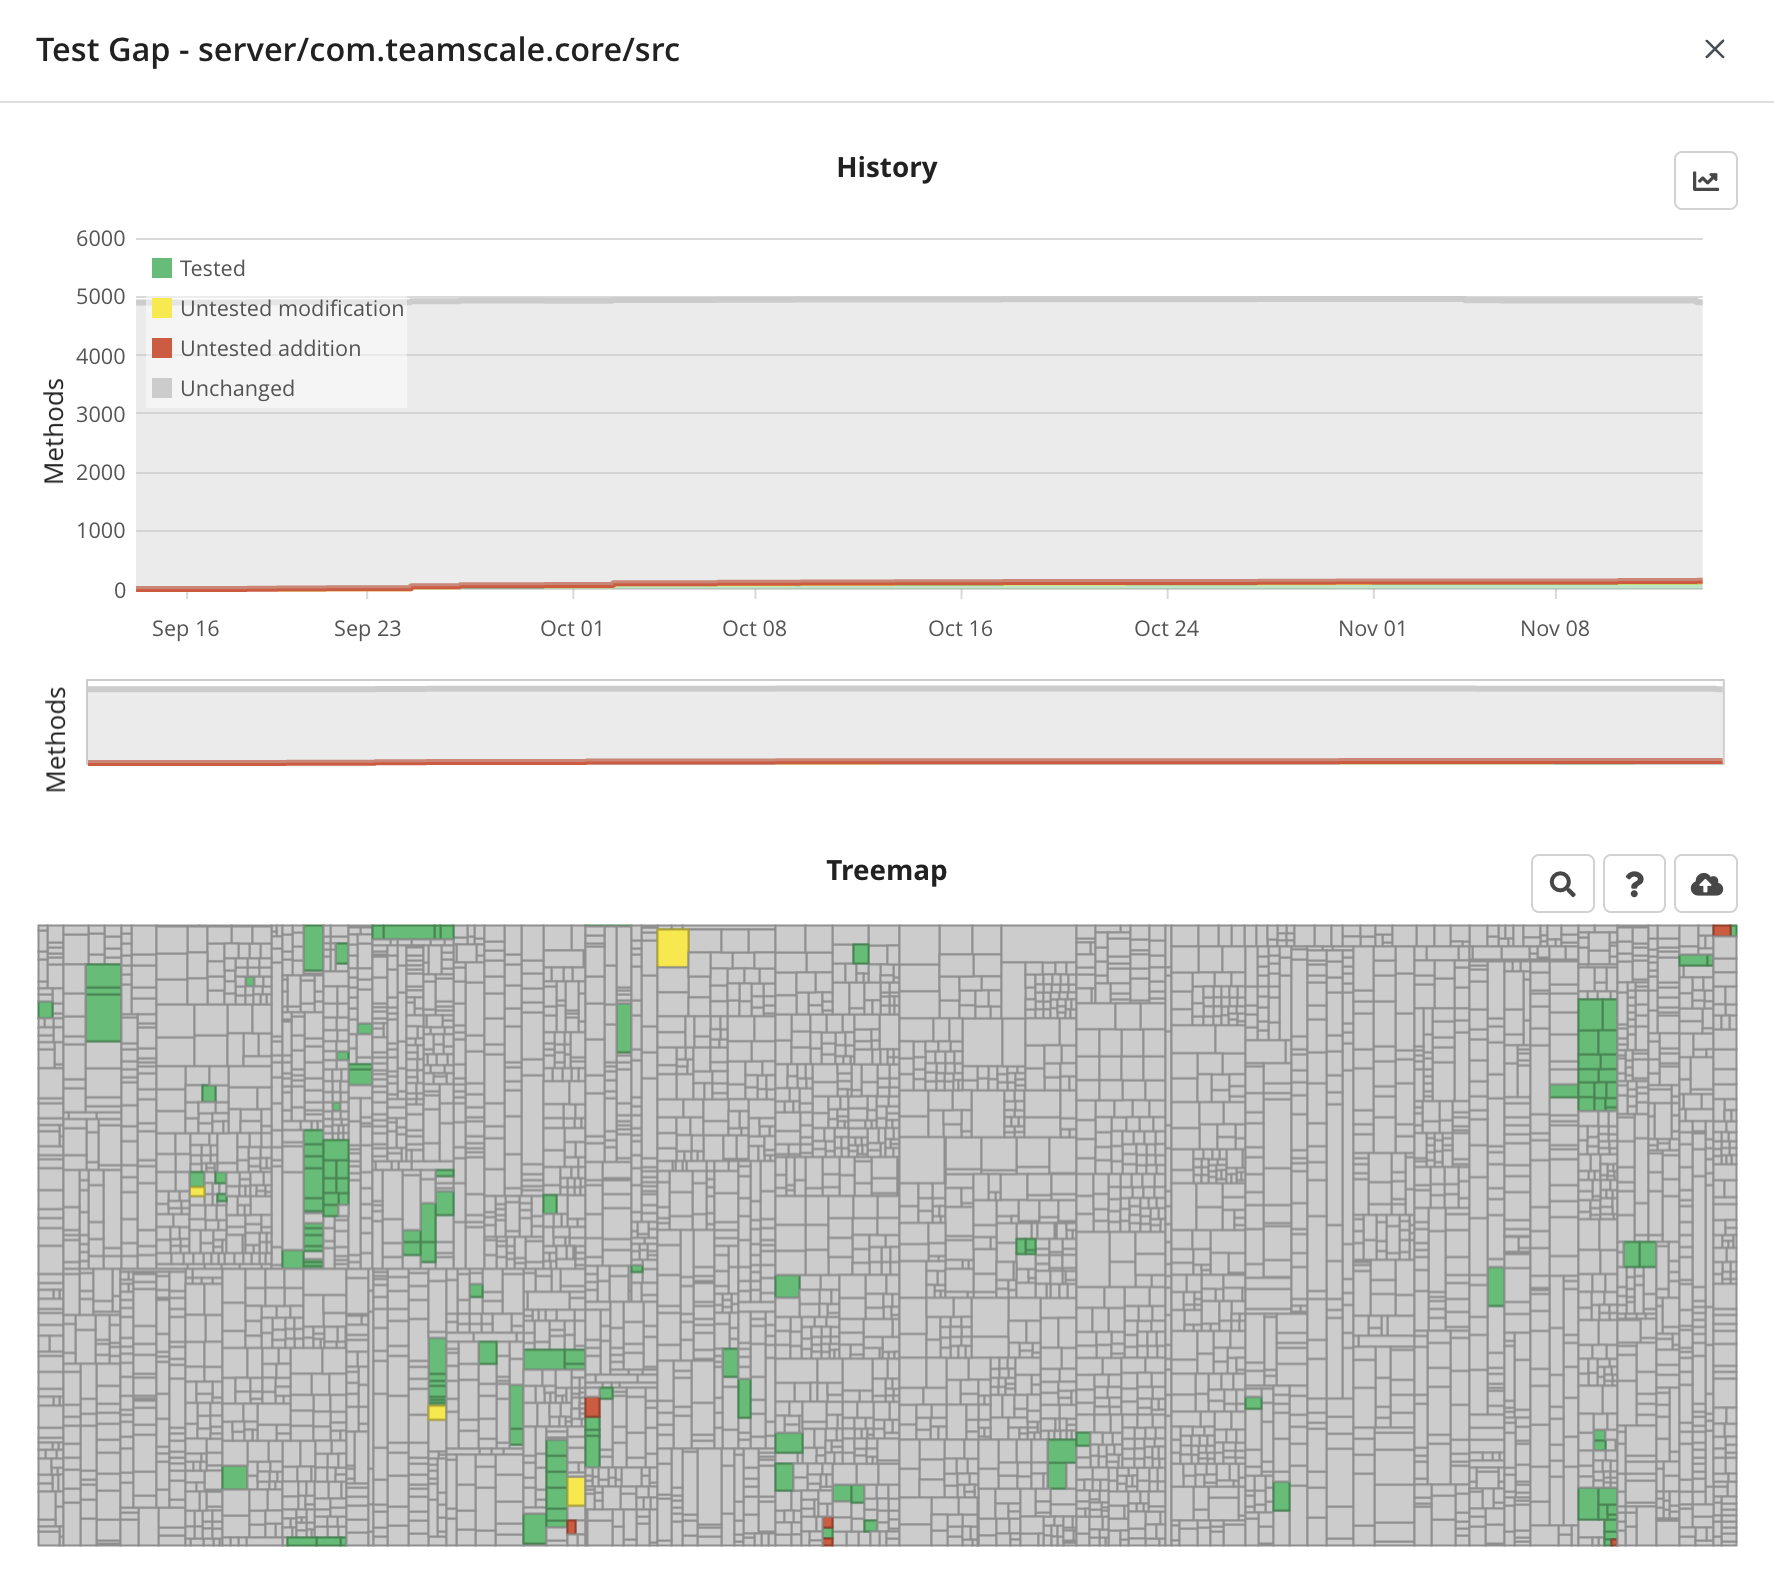
The dialog shows two kinds of data:
Test Gap Trend Shows the distribution of the selected test-gap metric over history.
Test Gap Treemap Displays all methods within the given folder or file, and their corresponding test gap status. The size of a rectangle corresponds to the length of the method. In case an entry from the »Execution« column was selected, every method will either be marked as green (executed) or gray (not executed). Hover over the treemap rectangles with your mouse for details.
Once you click on one of the rectangles (i.e. methods) in the treemap, the file containing the method will be opened in Teamscale.
Issues View
The Issue Test Gap subview of the Test Gaps perspective shows test gap information for each issue of a selected issue metric. For meaningful insights, the following prerequisites have to be fulfilled:
An issue tracker has to be configured for the current project. Please refer to this article for configuration details.
Commits to the code base of the project specify the corresponding issue ID of the target issue in the commit message. For example, a commit message like »CR#1234 Added feature« could be mapped to an issue with ID 1234. For details, please check this article.
Test coverage has been uploaded to Teamscale
At least one issue metric was configured
Once all of these prerequisites are met, selecting an issue metric from the dropdown within the Issue Test Gap view will show results similar to this screenshot:
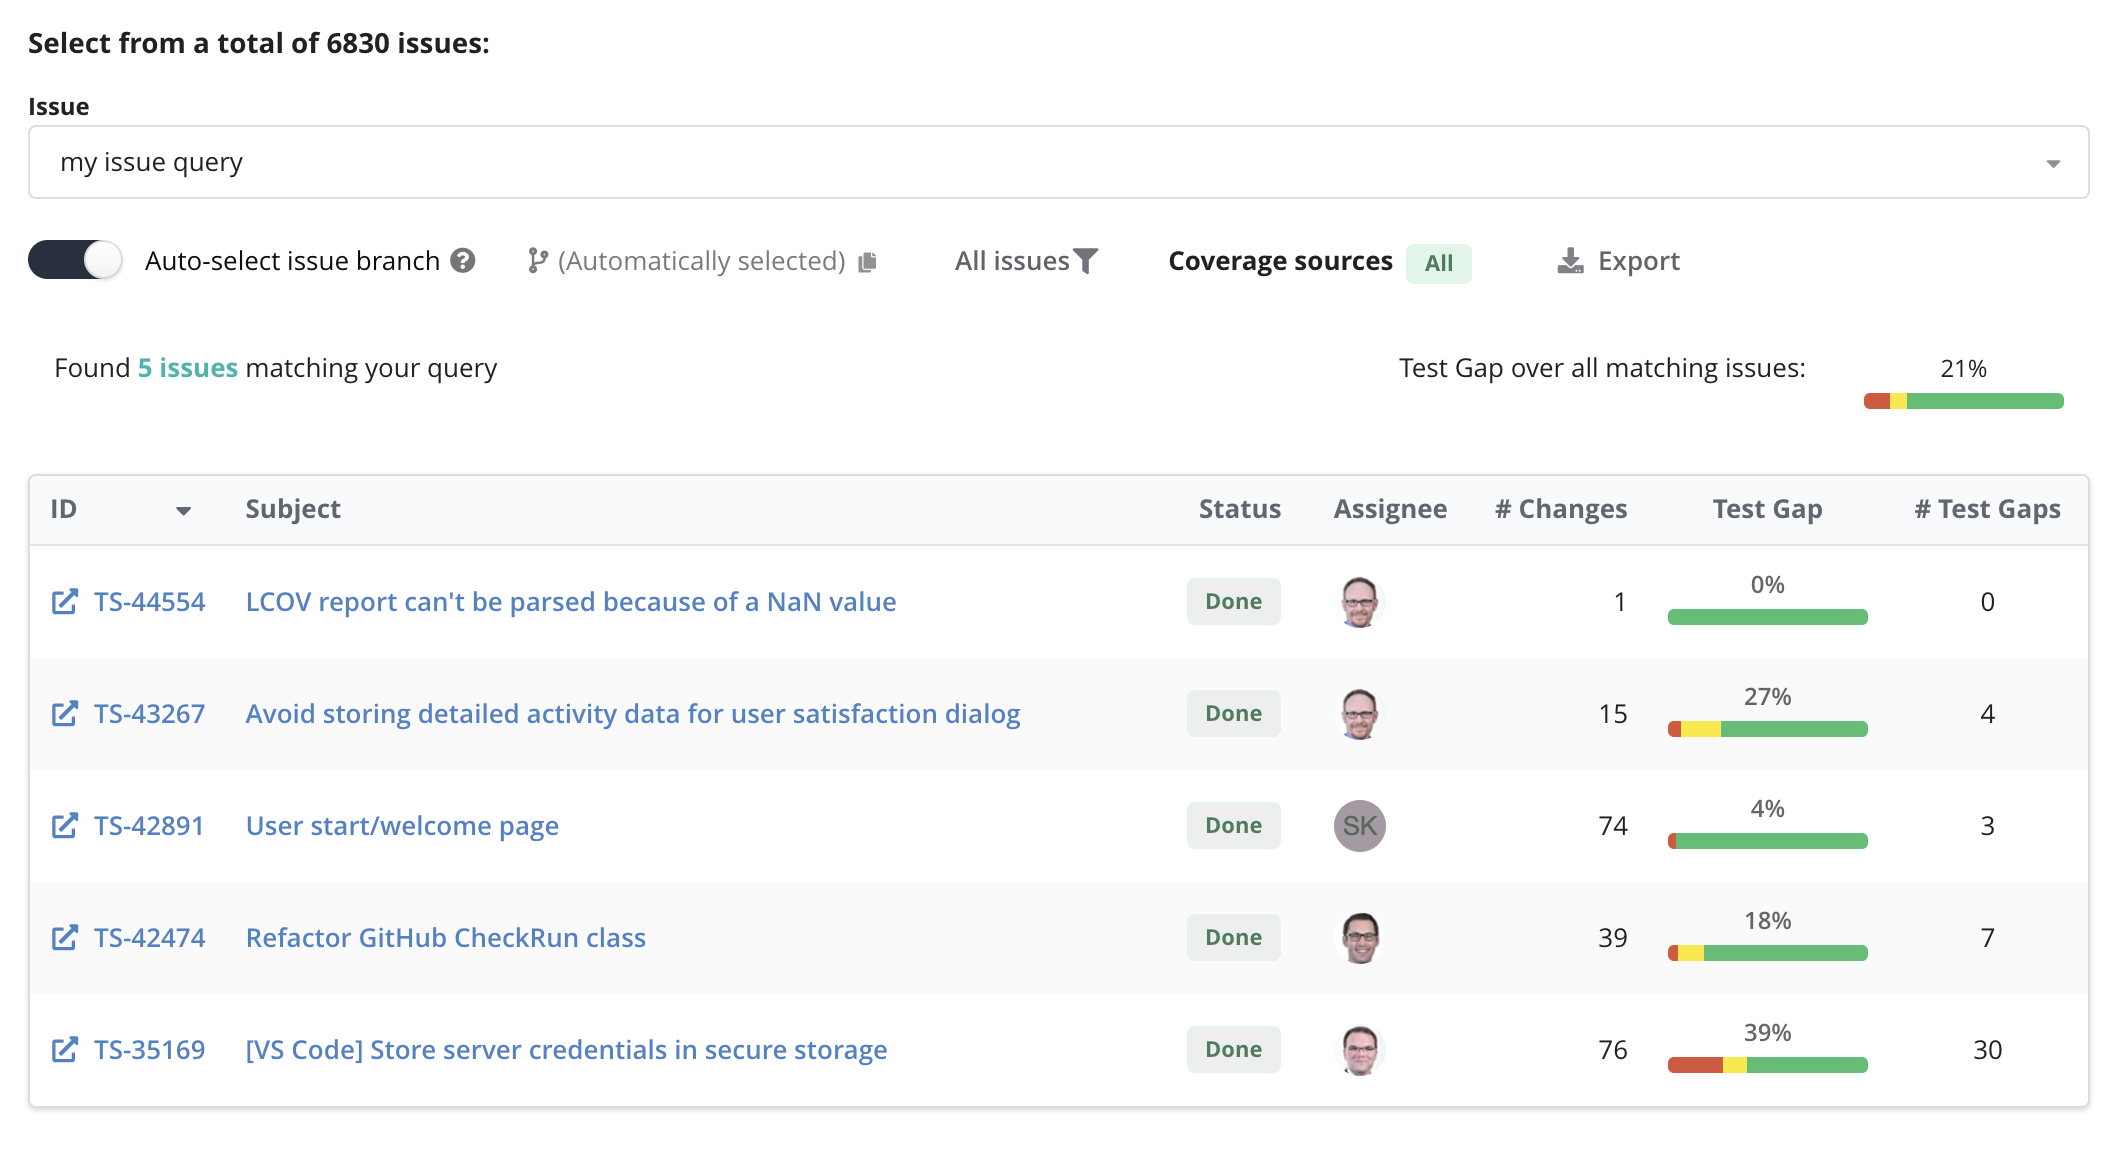
The bar in the Test Gap column visualizes which percentage of the code edited for the corresponding issue was untested after its most recent (significant) change. A gray bar with the »N/A« label usually means that no files known to Teamscale were affected by the commits for the issue. A click on a table entry will show detailed information about the issue, including the test gap treemap, which represents a more fine-grained visualization of the test gap data:
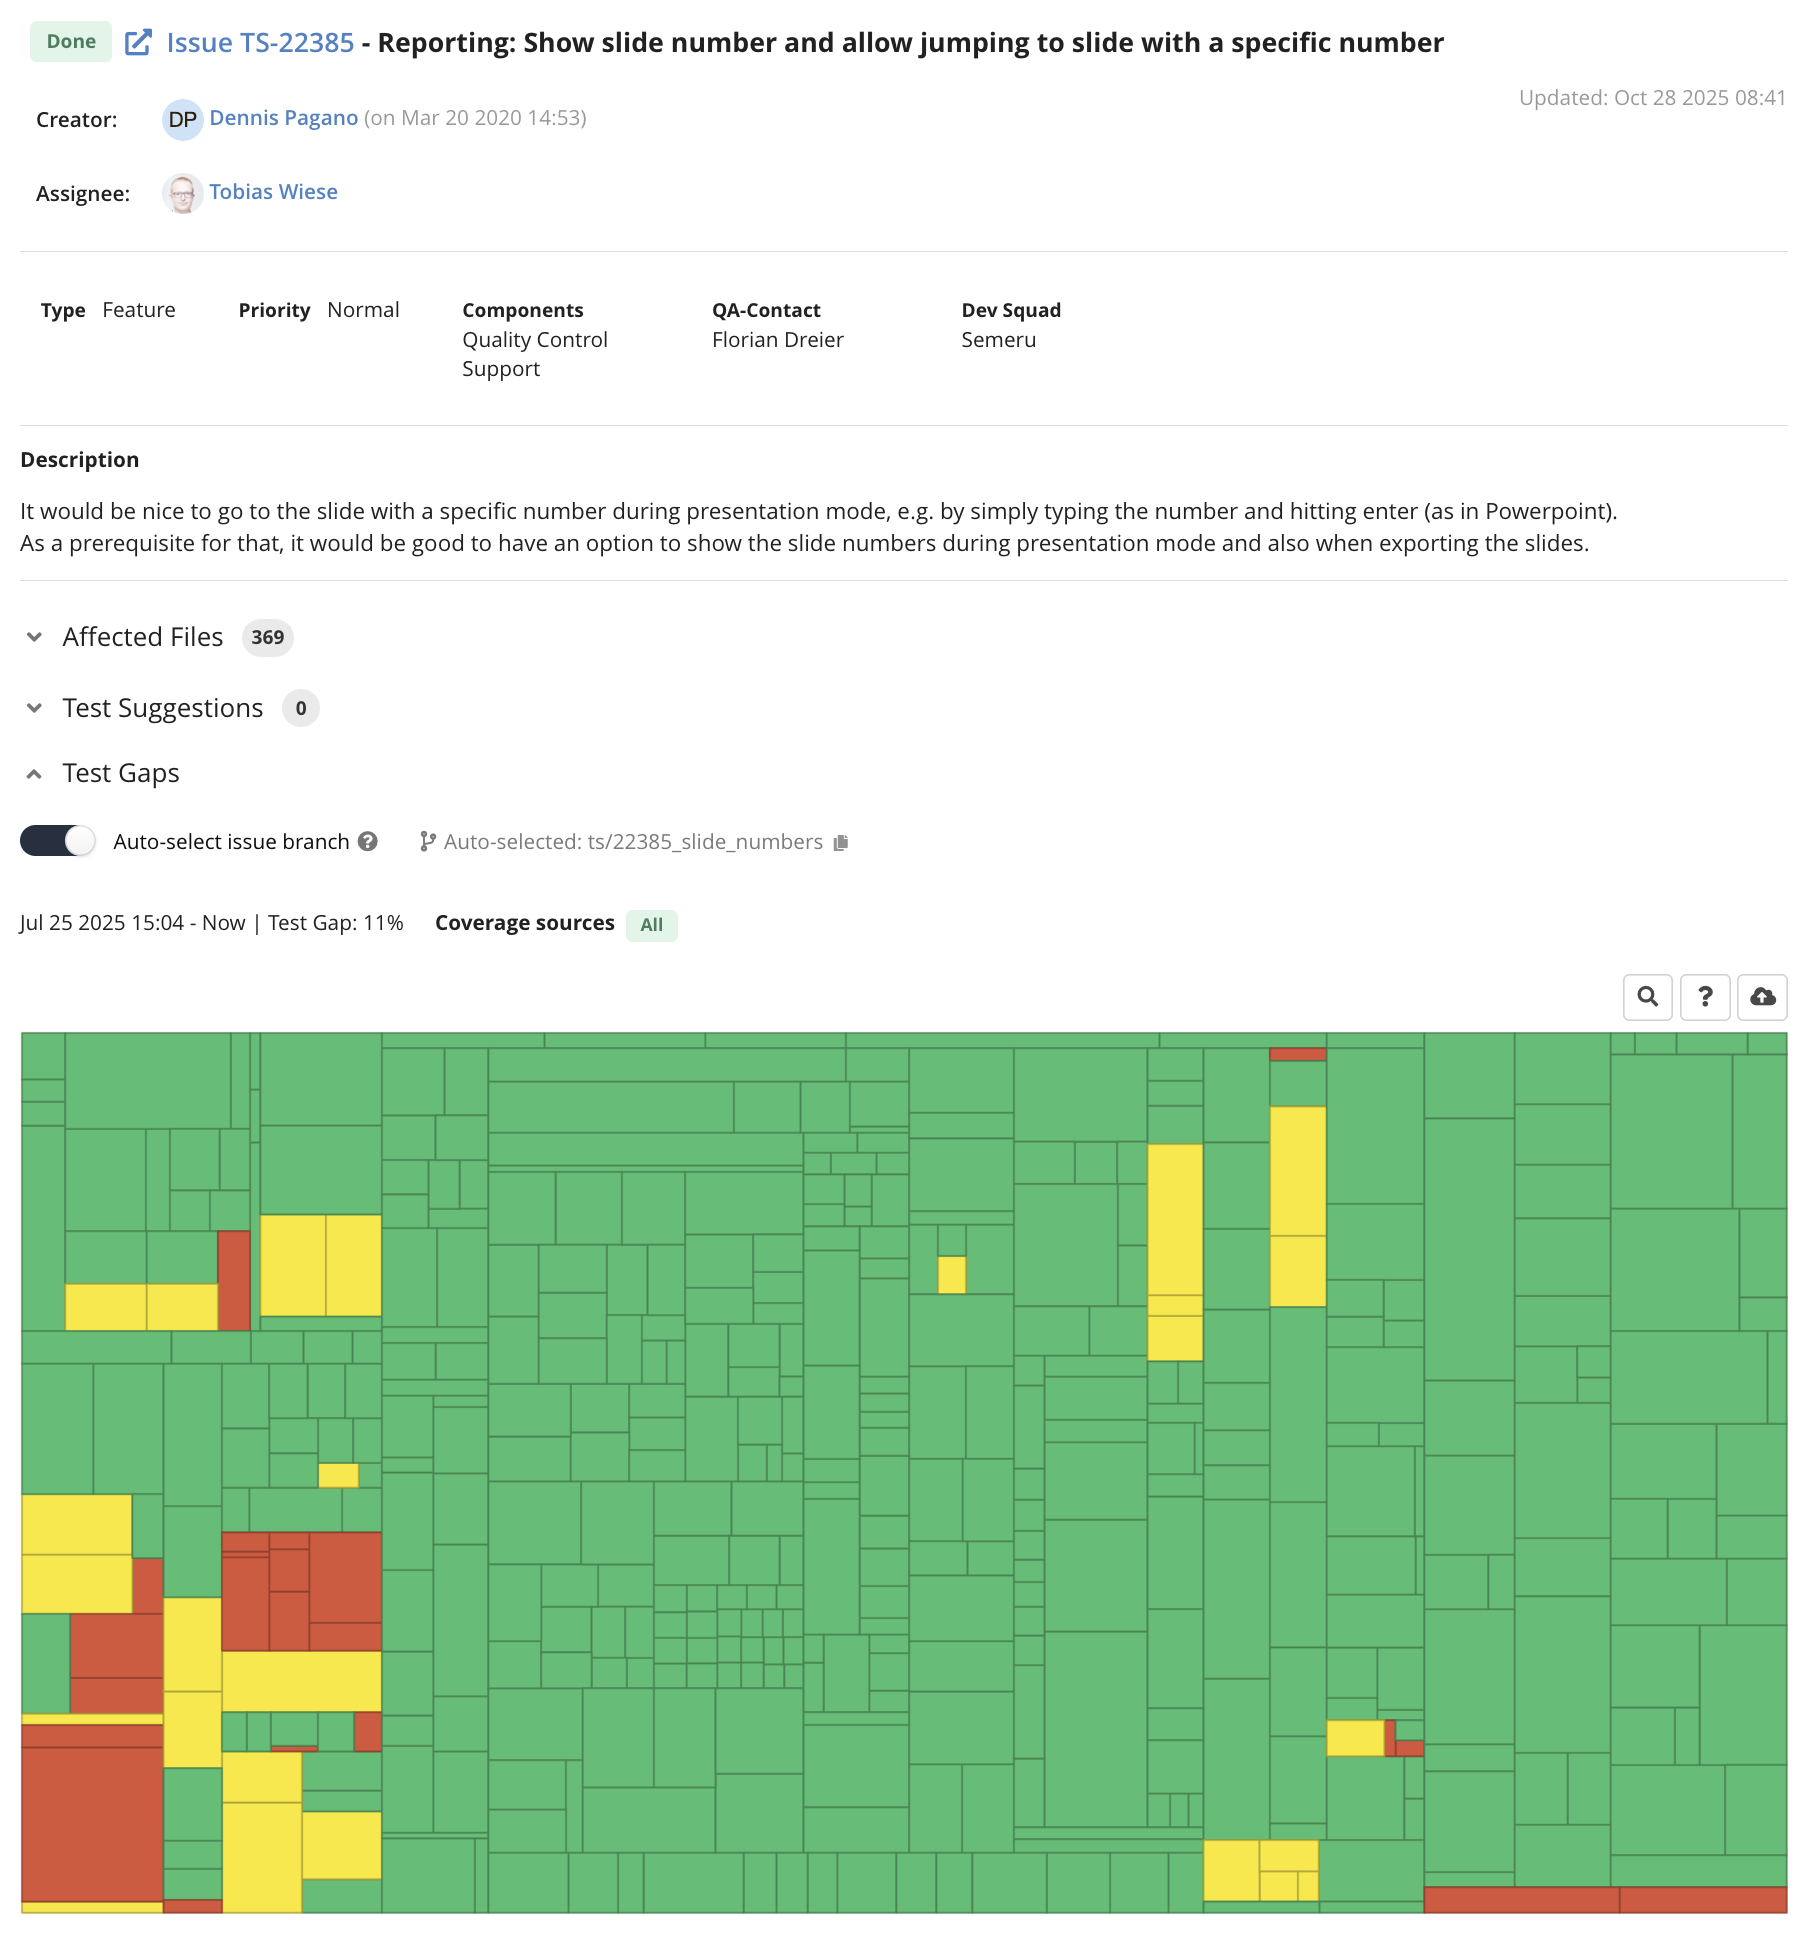
You can learn more about this view in the article on the Issue Details.