Code File View
Often, browsing a directory or component structure ends when a certain source code file was found. Each code file can be viewed directly in Teamscale, which looks like this:
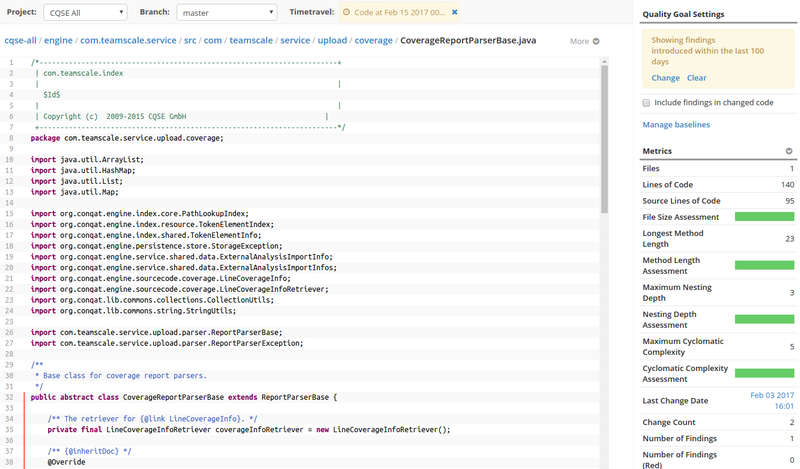
The Code File View e.g., appears after clicking on a file in the Metrics Overview Table and shows the source code text together with additional information. It consists of the Bread crumbs and a More button, the code itself and a sidebar.
The sidebar contains the Quality Goal Settings , the Metrics Table as well as information about Coverage Highlighting (not pictured) and a Findings List (not pictured). Each element is described in more detail in the following:
Timetravel UI: It shows the date for which the code is displayed.
Bread Crumbs: It displays the position of the current file in the code hierarchy.
More Button: It allows you to perform contextual actions (e.g., to download a file or to show its dependencies) which are described below.
Code Text: This renders the code of the current file with syntax highlighting. The orange lines at the beginning of a code line are finding markers. They indicate that a finding for this line exists. Hovering over the orange line displays a finding description which can be used to jump to the Findings perspective and see more details.
Quality Goal Settings: The quality goal setting lets you decide which filters to put on findings for code of the current file, i. e. which findings are (not) to be displayed.
Metrics Table:: The table presents several metrics together with metric values for the current file.
Findings List: This list contains all findings for the current file and can be filtered by clicking on Show filters.
Coverage Highlighting: If coverage for the current file exists (i. e. is known to Teamscale), covered lines are indicated by a green background color. If available, coverage highlighting can be turned on or off by clicking on the check box Annotate line coverage.
Each code file can be viewed in all its revisions available in the history. Clicking the Timetravel button in the top bar and choosing a particular date, baseline or revision, shows the code version of this point in time.
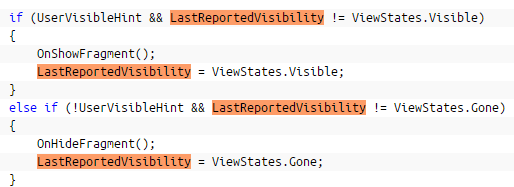
To read the source code, developers often mark a specific code element to view all its occurrences. Clicking on a specific code element, e.g. a variable, highlights all occurrences of this variable. A marker appears on the right side of the code text visualizing where in the file the code element occurs:
The More button provides several more options. Choosing option Download from the context menu, downloads the current file to the local device. Choosing option Download anonymized downloads an anonymized version of the current file (e.g., for bug reporting). Clicking View resource history (shortcut: H) allows you to view the history of the file at hand. Moreover, Show dependencies (shortcut: D) lets you view the (outgoing and incoming) dependencies of the current file
File History View
In addition to a particular version of a source code file, you can also use Teamscale to browse the history of a file. Whenever you are viewing an individual file in the Code Detail View, clicking More and then choosing the option Browse history from the menu (or pressing key H) will show you the history of the file in the Code History View. This view presents the history of activities for a particular file:
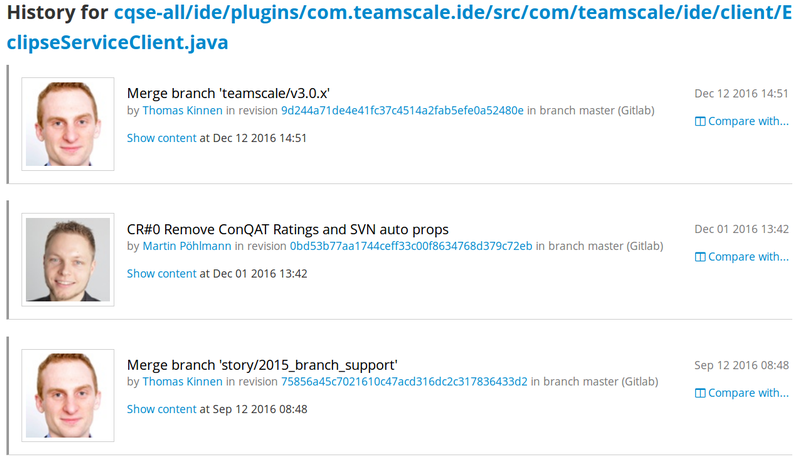
It consists of a list of commits which is ordered according to time. Each activity consists of a commit message, an author, a revision and a branch as well as a date.
The Code History View provides several possibilities. Clicking Show content of a commit, opens the Code Detail View and shows the code in the version of the selected commit. Clicking the commit message or the revision number displays the commit in the Commit Details View of the Activity perspective. Clicking on Compare with ... of two commits opens the Code Comparison View and allows to compare two versions and identify differences.
Code Comparison View
This view shows two files - usually the same file in different versions - next to each other and highlights differences between both:
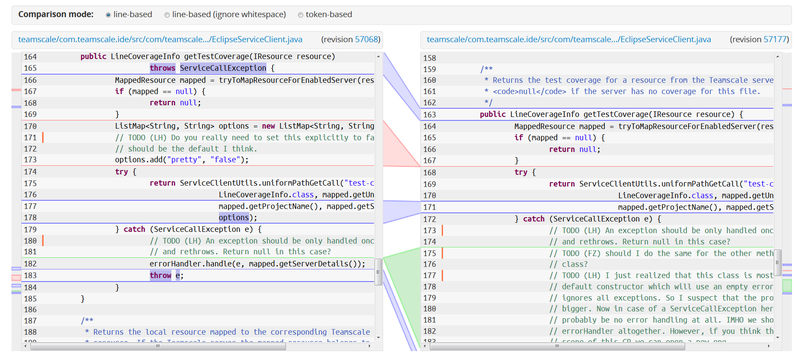
It displays the Comparison Mode at the top of the view, the older version of the code on left side and the newer version of the code on the right side.
Comparison Mode: This indicates the current comparison mode. Comparison mode can be line-based, line-based (ignoring white space) and token based. Clicking another radio button changes the comparison mode.
Code on the Left: This presents code of the older file. Additionally, it shows the path and the revision of the older file.
Code on the Right: Similarly, this presents the code, path and revision of the younger file.
Visualization of differences: This shows differences between the code on both sides. Blue differences denote differing code on both sides, green differences denote code only present in the left, older code and red differences denote code only present in the right, newer code.
Scrolling or clicking the visual summary allows to navigate in the code and inspect differences. The shortcut »Alt+N « allows you to jump to the next difference, the shortcut »Alt+Shift+N « allows you to jump to the previous difference. Clicking the path on top of one side shows only one code version and opens the Code Detail View. Clicking the revision of one side shows the revision of in the Activity Perspective.
Action: Viewing the Dependencies of a Class
In the Code Detail View, clicking More and choosing option Show dependencies from the context menu or pressing key »D«, shows the dependencies of the current file. This will open the Code Dependency View. Please note that this only works if architecture analysis is activated in the analysis profile.
Code Dependency View
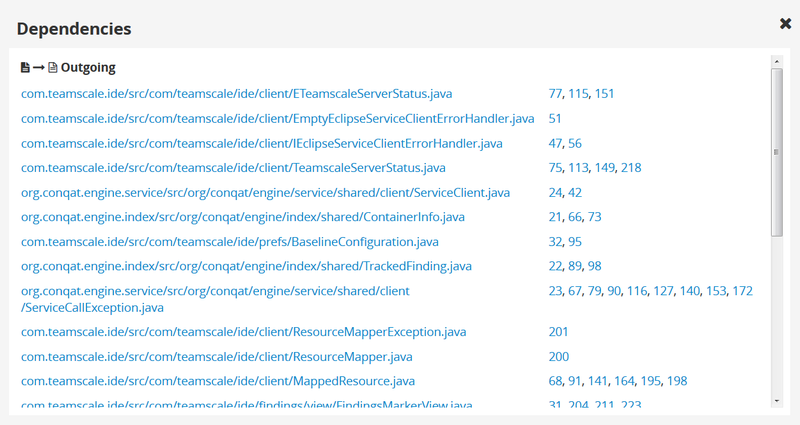
This view shows outgoing and incoming dependencies of a file on other files as well as frameworks and APIs:
TIP
Please note that this feature is available only if architecture analysis is activated.
The view consists of two lists, namely outgoing and incoming dependencies. Each dependency has a path and one or more numbers. The path denotes the file on which the current file depends (in case of outgoing dependencies) or the file which depends on the current file (in case of incoming dependencies). The numbers denote the lines of the current file which refer to the depending file (in case of an outgoing dependency) or the lines in the dependent file which refer to the current file (in case of an incoming dependency).
Clicking on the dependency path opens the dependency file and allows to inspect its code. Clicking on the line number jumps to the code location where a reference is made from or to the dependency file. This will open up the Code Detail View with the respective file.