Skip to content

How to Record Test Coverage for JavaScript Applications in the Browser

This how-to describes how test coverage information can be recorded for a JavaScript application running in a web browser (Firefox, Chrome, Electron, ...) using the Teamscale JavaScript Profiler, consisting of the instrumenter and the coverage collector.

The outlined approach is particularly suited for scenarios where the system under test is deployed to a server and tests are running against that server. This might either happen via manual tests or also by automated UI tests.
It is also suited for legacy systems that use a testing approach with no explicit means to collect coverage information.
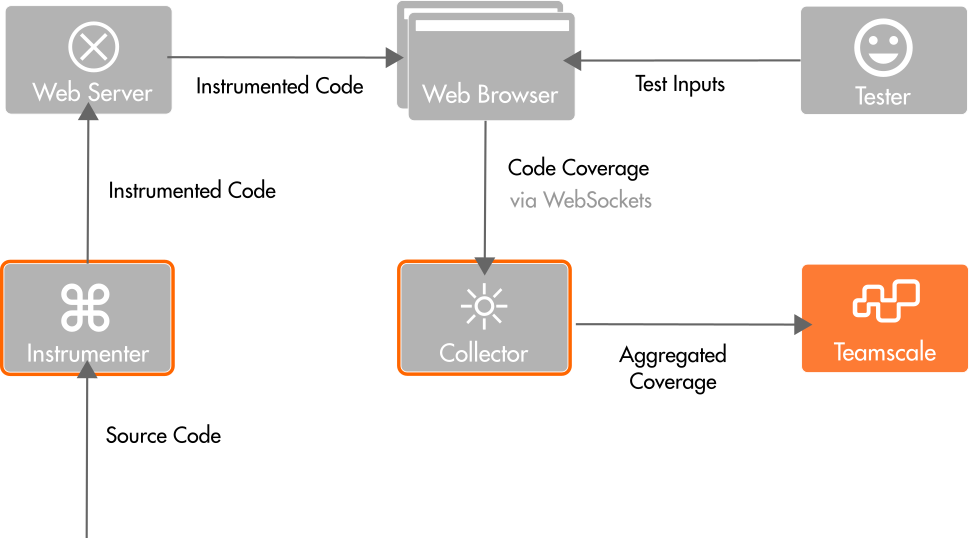
For NodeJS applications, please follow our NodeJS coverage How-To. For tests with a less complicated setup, for example, JavaScript unit tests, there are often simpler solutions which are discussed under alternatives.

Public Beta

The Teamscale JavaScript Profiler is still in the public beta phase. Your development and testing environment might not yet be fully supported by this approach. Please contact our support (support@teamscale.com) in case you encounter any issues.

Prerequisites

To use the approach, a number of prerequisites have to be in place.

The instrumented code must be executed in a (possibly headless) browser environment that supports at least ECMAScript 2015. Furthermore, we require that a DOM and WebSockets are available in that execution environment. In other words, the approach supports Edge >= v79, Firefox >= v54, Chrome >= v51, and Safari >= v10. Instrumented applications cannot be executed in NodeJS.

To run the components of the profiler, NodeJS in at least version 14 is needed.

Preparing your Application

Before we can instrument the application for sending coverage information to the coverage collector, the application has to be prepared: (1) source maps are needed to map back to the original code, (2) and the content security policy has to be adjusted to allow for sending the coverage information to the collector.

Source Maps

The code that is executed in the browser often does not correspond to the code written by the developers. It can be the result of several transformation steps, for example, compilation (transpilation) from other languages, source code minimization, or bundling.

The presence of source map files in the code of the test subject ensures that the tested code can be mapped back to the original. Depending on your build pipeline, a different approach must be chosen to add the source maps to the test subject's code bundle.

In the following we provide pointers to relevant configuration options for some of the popular tools used in context of JavaScript applications:

javascript
// tsconfig.json
{ compilerOptions: { sourceMap: true, inlineSources: true, ... }, ... }

See the Typescript documentation for more details and options.

Content Security Policy

To use this coverage collecting approach, the application's Cross-Origin Resource Sharing (CORS) has to be adjusted. The instrumented application sends coverage information via WebSockets to a collecting server. That is, communication via WebSockets must be allowed. Whether or not this is allowed is determined by the Content-Security-Policy attribute. This attribute is either part of the HTTP header sent by the Web server delivering the Web application, or by a corresponding HTML entry. If the collecting server is running on the same machine as the browser, then communicating with localhost must be allowed by adding ws://localhost:* for connect-src, blob, and worker-src to the Content-Security-Policy header.

The following snippet shows the content security policy that has to be added for allowing accessing the collector at host <collectorHost> on port <port>:

connect-src 'self' ws://<collectorHost>:<port>;
script-src 'self' blob: ws://<collectorHost>:<port>;
worker-src 'self' blob: ws://<collectorHost>:<port>;

By not specifying a content security policy, everything would be allowed. This can also be specified explicitly, for testing environments:

default-src * data: blob: filesystem: about: ws: wss: 'unsafe-inline' 'unsafe-eval' 'unsafe-dynamic'; script-src * data: blob: 'unsafe-inline' 'unsafe-eval'; connect-src * data: blob: 'unsafe-inline'; img-src * data: blob: 'unsafe-inline'; frame-src * data: blob: ; style-src * data: blob: 'unsafe-inline'; font-src * data: blob: 'unsafe-inline';

The place to configure the content security policy depends on the backend framework that serves the frontend code. See, for example, the Spring documentation on that topic.

Instrumentation

Before the coverage collector can receive any coverage information from a JavaScript application, this application has to be instrumented to collect and send this coverage information. Our JavaScript instrumenter package can be used for this purpose.

Installing and Running

The instrumenter is available as a NodeJS package with the name @teamscale/javascript-instrumenter.

We recommend npx to execute the instrumenter. For example, the following command is used to instrument an example app.

bash
npx @teamscale/javascript-instrumenter \
    test/casestudies/angular-hero-app/dist/ \
    --collector localhost:54678 \
    --in-place \
    --include-origin 'src/app/**/*'

This command instructs the instrumenter to instrument the code in the target folder test/casestudies/angular-hero-app/dist/. The instrumentation is done in-place (--in-place), that is, existing files are replaced by their instrumented counterparts.

Configuration

The instrumenter can be configured by several parameters. We discuss some of them in the following sub-sections.

Collector

-c COLLECTOR, --collector COLLECTOR

Sets the URL of the collector to send the coverage information to. Either a pair of hostname and port, separated by colon, or a URL pointing to the collector must be provided, for example, test-env.company.com:54678 or wss://test-env.company.com:54678. Please note that the specified collector must be reachable from clients that run the instrumented app to be able to collect coverage.

--relative-collector RELATIVE_COLLECTOR

In case the collector URL is not known at instrumentation time, e.g. when deploying dynamically to Kubernetes clusters, you can instead specify a pattern how to derive the collector URL from the application's URL.

Available operations:

  • replace-in-host:SEARCH REPLACE replaces the literal term SEARCH once in the hostname with REPLACE.
  • port:NUMBER changes the port to NUMBER.
  • port:keep keeps the port of the application (instead of using the chosen scheme's default port).
  • scheme:SCHEME changes the URL scheme to one of ws, wss, http or https.
  • path:PATH uses the URL path PATH (instead of no path).

Example: Your application is deployed to http://app.env44.cluster:8080/app and your collector is deployed to wss://collector.env44.cluster/collector. env44 is a dynamic name that is different for every deployment. In this case, you can configure the pattern replace-in-host:app:collector,scheme:wss,path:collector. This tells the instrumentation to replace the literal string app in the application's runtime URL with collector to find the collector's URL, change the scheme to wss and append the path collector to the hostname.

Instrumentation Includes and Excludes

The instrumenter determines whether to instrument a particular code fragment or not by using include/exclude patterns. An JavaScript application is typically deployed by first performing various transformation steps on the original source file, for example, transpiling it from TypeScript to JavaScript, and then combining it with all the dependencies to bundles to be deployed and executed. For collecting coverage, the bundle files are then instrumented.

We provide two types of patters for excluding code from being instrumented: based on the origin of the code and based on the bundles the code was combined into.

Origin-based
-x [EXCLUDE_ORIGIN ...], --exclude-origin [EXCLUDE_ORIGIN ...]

-k [INCLUDE_ORIGIN ...], --include-origin [INCLUDE_ORIGIN ...]

Glob pattern(s) of files in the source origin to produce coverage for or exclude from instrumentation. Multiple patterns can be separated by space.

These patterns match file names found in the original source code files. They assume a source map to be present for files to instrument. The source map is then used to check if an instrumentation should be performed.

Bundle-based
-e [EXCLUDE_BUNDLE ...], --exclude-bundle [EXCLUDE_BUNDLE ...]

Glob pattern(s) of input bundle files to keep unchanged (to not instrument). This pattern matches the name of the final bundle files passed to the instrumenter as inputs. Multiple patterns can be separated by space.

Specifying Multiple Patterns

Multiple include and exclude patterns should be separated by space. Exclude patterns have precedence over include patterns. For example, the following configuration includes all *.js files inside src/app1 and src/app2 and its subdirectories, except for files ending with .bin.js and .log.js:

bash
npx @teamscale/javascript-instrumenter --include-origin 'src/app1/**/*.js' 'src/app2/**/*.js' --exclude-origin 'src/**/*.log.js' 'src/**/*.bin.js'

Target Path

The instrumenter can either replace existing files by their instrumented counterparts, or it can write the instrumented versions to a separate target path.

-i, --in-place

Instructs the instrumenter to replace the un-instrumented input files by their instrumented counterparts. Please be careful when using this parameter: Make sure that important changes to your code were saved in a separate location before performing the instrumentation. Typically, the in-pace instrumentation is performed on a target directory of the build process. The original source code files should not be instrumented in-place. Only instrument copies of them!

-o TO, --to TO

Path (directory or file name) to write the instrumented version to. In case the in-place instrumentation is not used and files are written to a separate path, the parameter --to has to be used to specify the target path.

Coverage Collection

Now that the code has been instrumented to produce and send coverage information, we describe how to set up the coverage collector. The address of this collector is later instrumented into the code of the test subject.

Installing and Running

The collector is available as a NodeJS package. The package is available with the name @teamscale/coverage-collector in the NodeJS package manager.

Running using NPX

The collector can be installed and started using the npx command. The following command starts the collector on the default port 54678. The coverage will be dumped into the default folder ./coverage:

bash
npx @teamscale/coverage-collector

Running as Node Script

The package @teamscale/coverage-collector can be added as a development dependency to the package.json file. For example, by running npm install -D @teamscale/coverage-collector (or yarn add -D @teamscale/coverage-collector).

After installing the package it should be registered in the package.json and be available locally for being executed. Please check the NPM package registry for the latest version of the package regularly.

Now we have to start the collector before testing is done, and have to stop it after this process has been finished. For this, we propose to use the pm2 package. The usage of pm2 is illustrated by following scripts in a package.json (assuming that yarn is used):

"scripts": {
  "collector": "coverage-collector",
  "pretest": "npx pm2 delete CC; npx pm2 start npm --name CC -- run collector",
  "test": "jest",
  "posttest": "npx pm2 delete CC"
},

Please see the npmjs documentation for details on the pre and post scripts used in the above example.

ATTENTION

These scripts do not include an instrumentation step, which is mandatory for producing coverage information. Such a step will be introduced later in this how-to.

Configuration

The collector has three parameters that are relevant for typical application scenarios.

Collector Port

-p PORT, --port PORT

The port the collector is listening on for information from the JavaScript applications under test. Defaults to 54678. Please make sure that this port is accessible (allowed by firewalls) by all clients conducting tests.

Coverage File

-f DUMP_TO_FOLDER, --dump-to-folder DUMP_TO_FOLDER

The collector dumps coverage information to files in the Teamscale Simple Coverage format. By default, these files are written after the collector terminates and every 2 minutes (see below). Every dump creates a new timestamped file inside the folder provided with the parameter --dump-to-folder. By default, coverage information is written to the folder coverage in the current working directory.

Dump Interval

-t DUMP_AFTER_MINS, --dump-after-mins DUMP_AFTER_MINS

The collector can be configured to dump coverage information regularly after a configured time interval has elapsed. This parameter allows the user to specify the number of minutes after the information is dumped. Defaults to 2. To disable this feature you can set it to 0.

Control API

The upload parameters of the coverage collector can be controlled and queried remotely via a REST API. This API is enabled using the command line parameter --enable-control-port. For example, starting the collector with --enable-control-port 9872 makes the API available on port 9872 via HTTP.

-c ENABLE_CONTROL_PORT, --enable-control-port ENABLE_CONTROL_PORT

Enables the remote control API on the specified port. Disabled by default.

The following REST API methods are available:

  • [PUT] /commit Sets the commit to use for uploading to Teamscale. The commit must be in the request body in plain text in the format: branch:timestamp
  • [POST] /dump Instructs the coverage collector to dump the collected coverage.
  • [PUT] /message Sets the commit message to the string delivered in the request body in plain text. This message will be used for all follow-up report dumps (see --teamscale-message).
  • [PUT] /partition Sets the name of the partition name to the string delivered in the request body in plain text. This partition will be used for all followup report dumps (see --teamscale-partition). For reports that are not directly sent to Teamscale the generated report will contain the partition name as session ID.
  • [POST] /reset Instructs the coverage collector to reset the collected coverage. This will discard all coverage collected in the current session.
  • [PUT] /revision Sets the revision to use for uploading to Teamscale. The revision must be in the request body in plain text.

Note that neither authentication nor transport encryption are required to control the collector. In case this is a strict requirement of your organization, please setup a corresponding reverse proxy that establishes and ensures these properties.

Uploading Coverage for Inspection

When the code to be tested was instrumented and the collector is running, code coverage will be produced and collected when running the code. By default, the collector will write coverage files in the Teamscale Simple Coverage Format.

Whenever a testing process has been finished (for example, in the build pipeline), the coverage can be provided to Teamscale for being used, for example, for a Test Gap Analysis. This can be done by using the Teamscale Upload Tool or by using the REST API directly. More details can be found in the corresponding documentation.

Direct Upload from the Collector to Teamscale

Our coverage collector can be configured to send the collected coverage directly to a Teamscale server.

The upload is enabled by setting the URL of the Teamscale server using parameter --teamcale-server-url, along with parameters that define the target project and commit of the upload:

-u TEAMSCALE_SERVER_URL, --teamscale-server-url TEAMSCALE_SERVER_URL

Upload the coverage to the given Teamscale server URL, for example, https://teamscale.dev.example.com:8080/production.

--teamscale-access-token TEAMSCALE_ACCESS_TOKEN

The API key to use for uploading to Teamscale.

--teamscale-project TEAMSCALE_PROJECT

The project ID to upload coverage to.

--teamscale-user TEAMSCALE_USER

The user for uploading coverage to Teamscale.

--teamscale-partition TEAMSCALE_PARTITION

The partition to upload coverage to.

--teamscale-revision TEAMSCALE_REVISION

The revision (commit hash, version id) to upload coverage for.

--teamscale-commit TEAMSCALE_COMMIT

The branch and unix epoch timestamp in milliseconds to upload coverage for, separated by colon. Examples: master:1708165304 or trunk:HEAD (uploads to the latest commit on trunk).

--teamscale-repository TEAMSCALE_REPOSITORY

The repository to upload coverage for. Optional: Only needed when uploading via revision to a project that has more than one connector.

--teamscale-message TEAMSCALE_MESSAGE

The commit message shown within Teamscale for the coverage upload. Default is "JavaScript coverage upload".

Please note that all of the listed command line parameters can also be set via environment variables. For example, instead of passing the parameter --teamscale-access-token you can define the environment variable TEAMSCALE_ACCESS_TOKEN, instead of the parameter --teamscale-server-url you can define the variable TEAMSCALE_SERVER_URL.

Direct Upload from the Collector to Artifactory

Our coverage collector can be configured to send the collected coverage directly to Artifactory.

The upload is enabled by setting the URL of the Artifactory server using parameter --artifactory-server-url, along with parameters that define the target partition and commit of the upload:

--artifactory-server-url ARTIFACTORY_SERVER_URL

The HTTP(S) url of the artifactory server to upload the reports to. The URL may include a subpath on the artifactory server, e.g. https://artifactory.acme.com/my-repo/my/subpath.

--artifactory-access-token ARTIFACTORY_ACCESS_TOKEN

Recomended: The API key for Artifactory for a user with write access (c.f. Artifactory Documentation)

--artifactory-user ARTIFACTORY_USER

The name of an artifactory user with write access. We recommend using --artifactory-access-token over a username and password.

--artifactory-password ARTIFACTORY_PASSWORD

The password of the user. We recommend using --artifactory-access-token over a username and password.

--teamscale-partition TEAMSCALE_PARTITION

The partition to upload coverage to.

--teamscale-revision TEAMSCALE_REVISION

The revision (commit hash, version id) to upload coverage for.

--teamscale-commit TEAMSCALE_COMMIT

The branch and unix epoch timestamp in milliseconds to upload coverage for, separated by colon. Examples: master:1708165304 or trunk:HEAD (uploads to the latest commit on trunk). We recommend using --teamscale-revision if possible.

Please note that all of the listed command line parameters can also be set via environment variables. For example, instead of passing the parameter --artifactory-access-token you can define the environment variable ARTIFACTORY_ACCESS_TOKEN, instead of the parameter --artifactory-server-url you can define the variable ARTIFACTORY_SERVER_URL.

Upload via Proxy

If your Teamscale or Artifactory instance needs to be accessed through a proxy, you can configure the collector accordingly. Similar to the previous options, the proxy can be specified by a command line parameter or by its corresponding environment variable:

--http-proxy http://host:port/

Depending on the setup of your proxy, you may need to specify a username and password:

--http-proxy http://username:password@host:port/

Architecture

The profiler consists of two major components: the instrumenter and the collector. The instrumenter adds statements to the code that signal reaching a particular code line when running it in the browser. The obtained coverage is aggregated in the Web browser and sent to a collecting server (the collector) once a second. Besides the coverage information, also the source maps of the code in the browser are sent to the collector once. The collector uses the source map to map the coverage information back to the original code and builds a coverage report that can be handed over to Teamscale. Teamscale uses the coverage information, for example, for Test Gap analysis.

An overview of the components of the Teamscale JavaScript Profiler and their interactions is given in the following illustration:

Overview

Troubleshooting

Collector: Unable To Verify The First Certificate

In many cases, coverage will be uploaded via HTTPS to Teamscale or other REST services that can receive coverage reports. By default, NodeJS checks the certificates of these endpoints. That means that uploads to services, for which the certificate cannot be checked, fail with the error unable to verify the first certificate.

Setting the environment variable NODE_TLS_REJECT_UNAUTHORIZED to 0 for the Coverage Collector disables the check and is a workaround for this problem. Instead of failing, a warning will be shown in the log that hints at the disabled check.

We recommend to set proper CA certificates via the environment variable NODE_EXTRA_CA_CERTS. More details can be found in the official NodeJS documentation.

Instrumenter Runs Out Of Memory

In case the application to instrument is too big, the instrumenter might run out of memory. In this case, you can increase the memory available to NodeJS by setting parameter max-old-space-size in the NODE_OPTIONS environment variable.

We recommend to use the cross-env package for setting the NODE_OPTIONS in NodeJS environments. For example, cross-env NODE_OPTIONS='--max-old-space-size=8192' npx @teamscale/javascript-instrumenter will increase the memory limit to 8GB for the given instrumenter invocation.

Instrumented App Is Slow

After instrumenting your application for recording coverage information, it might become significantly slower. One cause of this could be that not only the application code was instrumented, but also the code of the frameworks (for example, Angular or React) and other libraries.

We recommend to instrument only those fraction of the application for that you would like to collect coverage information for. See Instrumentation Includes and Excludes.

Alternatives

The above approach works for all JavaScript applications that are run in the browser.

For automated UI tests, Cypress can dump coverage information from the V8 JavaScript engine.

For unit tests, established tools such as Jest can produce coverage reports.