Setting Up Test Coverage Profiling for Java
In order to use the Test Gap analysis, you need to record test coverage and upload it to Teamscale. To record test coverage for Java (or other JVM languages, such as Kotlin), we recommend you use either JaCoCo or the Teamscale Java Profiler. Our guidelines for this decision are:
- If you want to profile your unit tests or other automated tests that are run in your CI environment, use our Maven or Gradle plugin.
- If you want to profile manual tests, use the Teamscale Java Profiler.
- If you want to profile a long-running process and want to upload test coverage to Teamscale in regular intervals (e.g., when profiling a web application in a staging environment), use the Teamscale Java Profiler.
Checkout our tutorial
In our general Java TGA tutorial we outline the steps needed to set up TGA for a concrete sample project.
Using the Teamscale Java Profiler
The Teamscale Java Profiler is a JVM coverage profiler that builds on JaCoCo. It records coverage from a JVM process and uploads it to Teamscale at regular intervals. This simplifies profiling of tests in long-running environments, such as deployments running in an application server, as well as manual tests.
The following instructions are for setting up the agent on a server or local machine. If your application is instead running in Docker, please read our Docker guide instead.
Prerequisite: Generate git.properties
To upload the coverage to the correct commit in Teamscale, add a git.properties file to your jar/war. Depending on your environment there are multiple options:
Just add the following plugin to your build:
<build>
    <plugins>
		<plugin>
			<groupId>io.github.git-commit-id</groupId>
			<artifactId>git-commit-id-maven-plugin</artifactId>
			<version>9.0.1</version>
			<executions>
				<execution>
					<id>get-the-git-infos</id>
					<goals>
						<goal>revision</goal>
					</goals>
					<phase>initialize</phase>
				</execution>
			</executions>
			<configuration>
				<generateGitPropertiesFile>true</generateGitPropertiesFile>
			</configuration>
		</plugin>
    </plugins>
</build>
Now build and deploy your application.
Set Up a Profiler Configuration
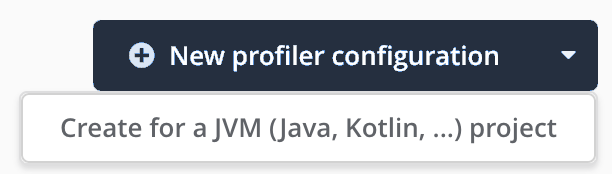
The profiler's configuration can be stored within Teamscale. This makes it easy to change and audit. To configure the profiler for your application, go to the Project Configuration > Coverage Profilers view. Open the dropdown of the New profiler configuration button and click on Create for a JVM (Java, Kotlin, ...) project.
You will be presented with a dialog that lets you generate a profiler configuration for a Teamscale project.
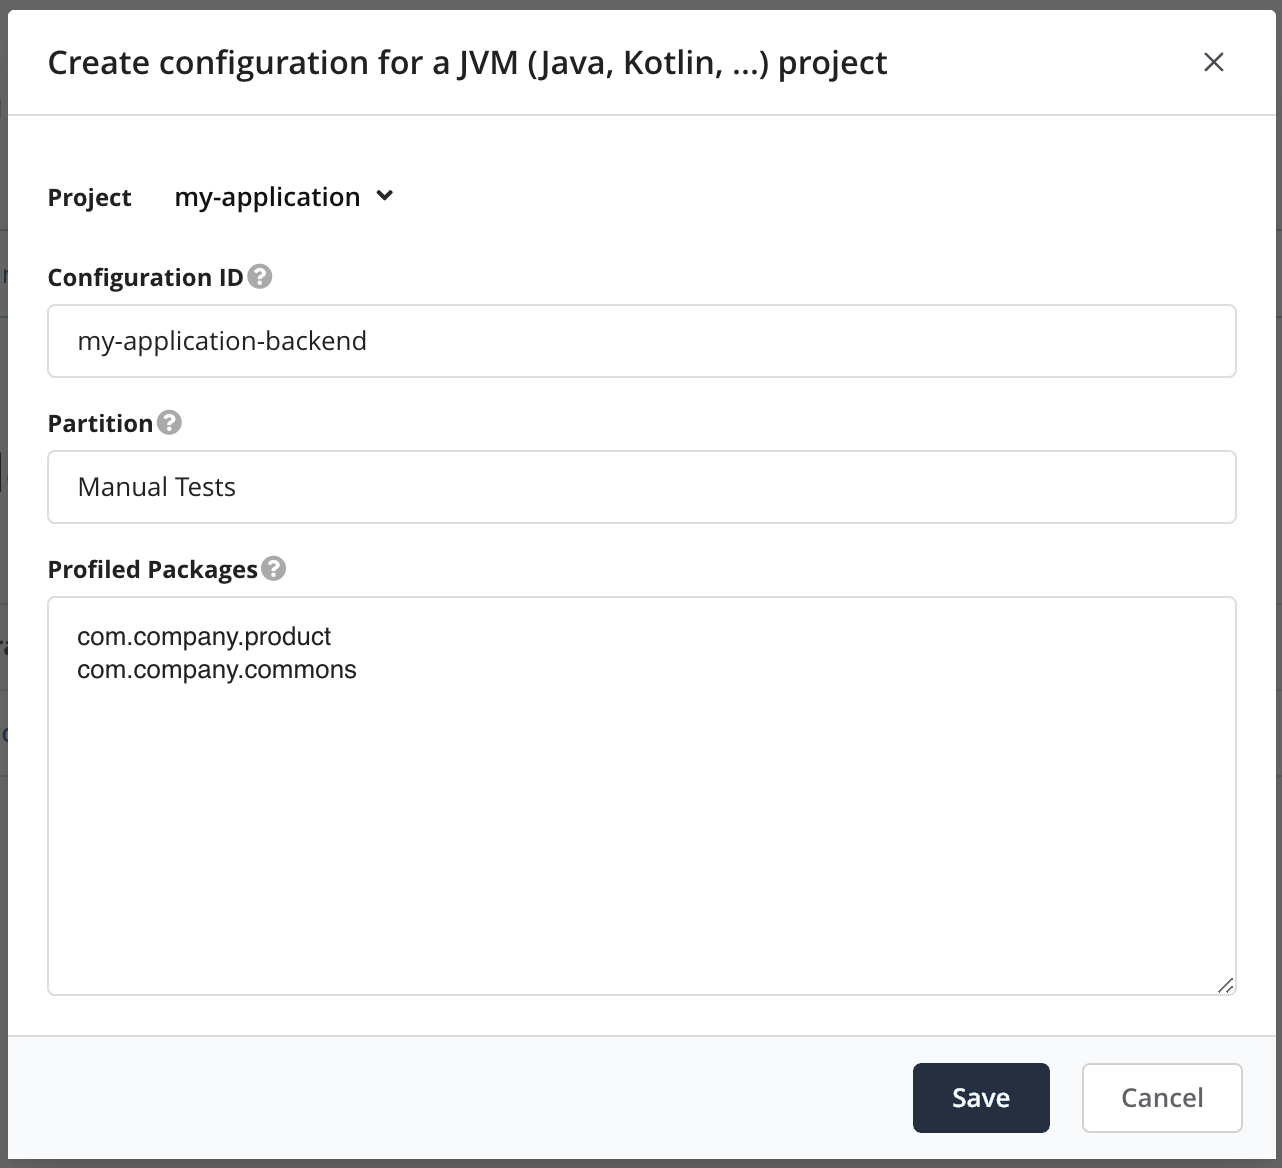
- Select the project that you want to collect coverage for.
- Choose a configuration ID. This ID will be used when starting the profiler so that it knows which configuration to use.
- Select a partition, which is a logical name that groups related coverage, e.g., the type of test that will be profiled (e.g., Manual Test, Unit Test, Regression Test).
- Select all packages that should be profiled. Subpackages are included as well.
Selecting Appropriate Packages
Teamscale automatically suggests packages to profile. Please review them carefully.
Please ensure the packages you select are "future-proof", i.e., they also match packages you might add in the future. This saves you time later, because you won't have to adjust the profiler configuration whenever you add new packages.
Make sure not to profile widespread packages that are also used by third-party software, e.g. net.java or com.
Finally, click Save.
The generated profiler configuration looks similar to the following:
includes=*com.company.product.*;*com.example.commons.*
teamscale-project=my-application
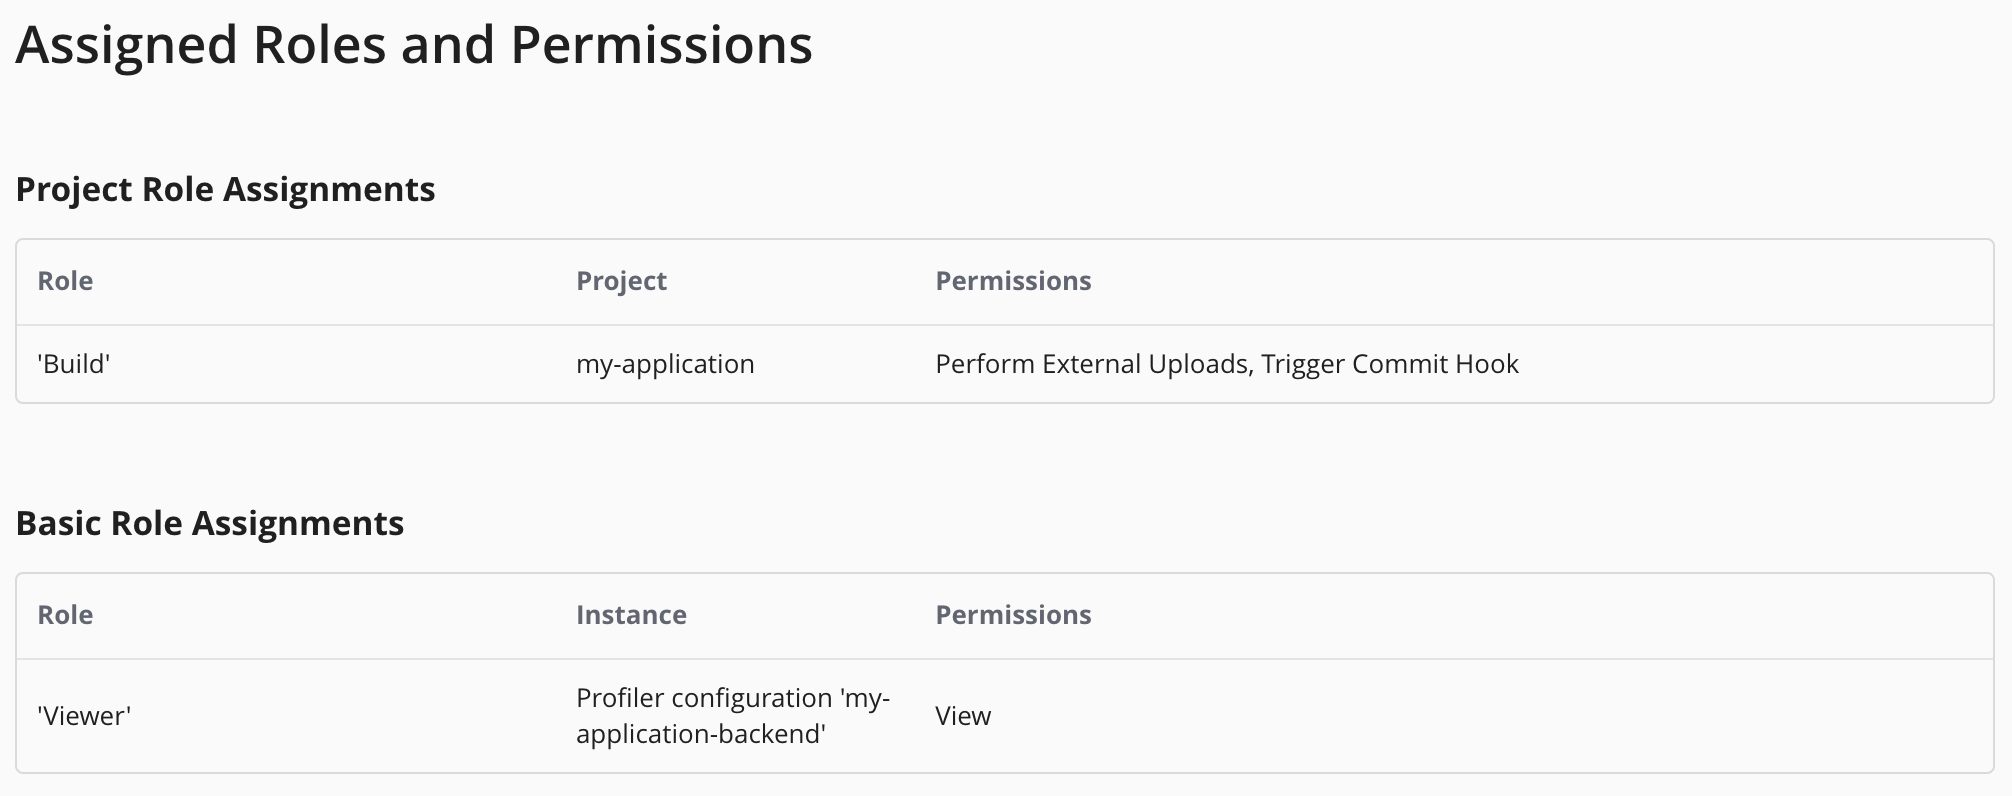
teamscale-partition=Manual TestsNext, please go back to the Project Configuration > Coverage Profilers overview. Click on the button next to the profiler configuration that you just created and assign Viewer permissions to the technical user that the profiler uses to connect to Teamscale.
Next, please go to Admin > Users and select the technical user whose credentials should be used for the coverage upload. Ensure that the user has the Perform External Uploads permission for the project. You can achieve this by assigning the pre-defined Build project role to the user.
Then generate an access key by clicking on Generate New Access Key and save it. We will need it in the next step.
Attaching the Teamscale Java Profiler to Your System Under Test
Docker or Kubernetes
Please follow our Docker how-to if your application is running in a Docker container.
Download the latest release of the Teamscale Java Profiler and extract it. Run the installer via the following command and replace the Teamscale server URL, user and access token from the previous step.
sudo ./installer install https://your.teamscale.url your-build-user-name your-access-tokenNow add the following environment variable to the start script of your System Under Test.
TEAMSCALE_JAVA_PROFILER_CONFIG_ID=my-application-backendMake sure to replace my-application-backend with the configuration ID you have chosen in the previous step. If you are using an application server like WebSphere, JBoss, Wildfly etc. please have look at the specific instructions.
The Environment Variable is Important
The installer will set up the Teamscale Java Profiler so it can profile all JVM applications on your system. However, it will only instrument applications and upload their coverage if you apply the environment variable to it.
Manual installation
In case you cannot or do not want to use our installer, follow these steps.
Move the extracted Teamscale Java Profiler somewhere next to your deployed application. We will refer to this directory as TEAMSCALE_JACOCO_AGENT_DIR in the following.
Now create a TEAMSCALE_JACOCO_AGENT_DIR/teamscale.properties file with the following content and replace the Teamscale server URL, user and access token:
url=https://your.teamscale.url
username=your-build-user-name
accesskey=your-access-token
As a next step, add the Teamscale Java Profiler as an agent to your system under test, by adding the following JVM argument to the configuration of your deployment.
-javaagent:TEAMSCALE_JACOCO_AGENT_DIR/lib/teamscale-jacoco-agent.jar=config-id=my-application-backendMake sure to replace TEAMSCALE_JACOCO_AGENT_DIR and my-application-backend with the actual agent file path and the configuration ID you have chosen in the previous step.
The Order of the Command-Line Arguments Matters
The -javaagent option must be specified before the -jar option!
If you are using an application server like WebSphere, JBoss, Wildfly etc. please have look at the specific instructions.
Uploading Coverage via the Teamscale Java Profiler
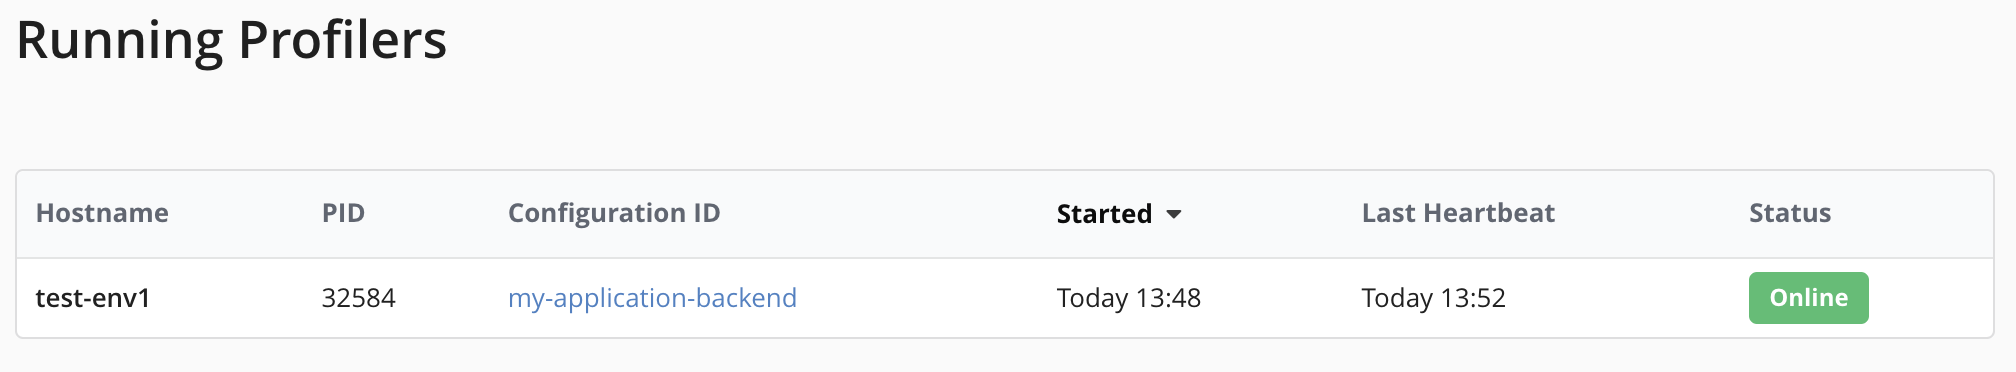
Now start your system under test, as you normally do. In the Project Configuration > Coverage Profilers view you should see an entry that shows that your application is running with the profiler attached to it.
Now perform some actions in your application, such that some part of the functionality is executed. Then shut down the application. The agent automatically uploads the coverage to Teamscale. By default, the upload happens at an interval of 8 hours and on JVM shutdown. The interval is useful for long-running applications like web applications where coverage should be reported continuously without restarting the application. It can freely be adjusted to fit your needs, by adding, an e.g., an interval=60 entry to the profiler configuration, to set the upload interval to 60 minutes. But be aware that intervals smaller than 2 hours might slow down your Teamscale instance, depending on the amount of coverage data generated.
For a detailed reference on all the configuration options of the Teamscale Java Profiler, please refer to the agent's documentation.
Validating Coverage Recording
Open the Test Gaps perspective and select your project and the branch from which the deployed application has been built from. Also make sure the new coverage partition is selected in the coverage partition chooser. Next, click on the Execution cell of the Summary row. 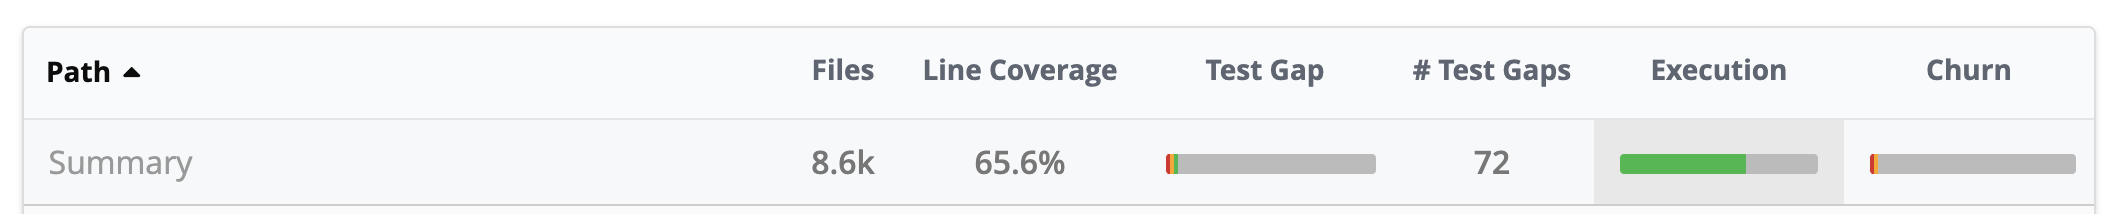 A dialog opens and should show some green rectangles, which represent the covered methods.
Troubleshooting Missing Test Coverage
In case you do not see test coverage in the treemap, e.g., no green rectangles, please check whether the agent's log files (/tmp/teamscale-java-profiler-<PID>-<random string>/logs/) contain any relevant warnings or errors. Please also check the points mentioned in the "Test coverage does not show up in Teamscale" Troubleshooting section. In case you still do not receive proper coverage, you might want to turn on debug logging in the Teamscale Java Profiler and have a look at the log files. Please refer to the profilers documentation for more details.