Metrics Perspective
The Metrics perspective is the central place for metrics of your system. The perspective provides multiple pages that show metrics for different artifact types. On the Files page, the metrics are aggregated based on the directory hierarchy. On the Components page, they are aggregated based on architectural components. Additionally, the perspective also shows non-code metrics, such as build status or test execution
Metrics Overview Table
When activating the Metrics Perspective, Teamscale shows the Files page with a metric overview table:

This looks quite similar for the other pages.
Each page presents a different artifact type:
- Files Shows metrics aggregated based on the code directory structure.
- Components Shows metrics aggregated based on components from an architectural definition.
- Issues Shows metrics for each issue metric. Issue metrics can also be hierarchically structured by using slashes in the metric name.
- Spec Items Shows metrics for each specification item metric. Specification item metrics can also be hierarchically structured by using slashes in the metric name.
- Tests Shows metrics for tests. See Tests for more details.
- Custom Artifacts Shows metrics for custom artifacts. You can upload custom artifacts metrics like build execution times or other numbers that cannot be directly attached to a specific file.
Navigating into Sub-Folders
Each of these three sections can be used as a starting point to navigate deeper into the metrics' hierarchy. From the code table, you descend into folders, whereas the architecture section table allows you to descend into subcomponents of your system. Both ways will, at their lowest level, result in an actual code file in the Code Detail View. To see this navigation in action, simply click on a folder name of the Code section to load the content of this package. In the following paragraphs, we take a closer look at the views you will encounter when you are browsing through the metrics. All of the three sections mentioned above work in an analogous way. In the Code section, you can navigate and analyze the code in two dimensions - with respect to directory structure and time. By default, this section contains two elements:
Metrics Overview Table: The Metrics Overview Table consists of one row for each file or directory in the current directory. Furthermore, it consists of several columns showing metric values for these files and directories. The first line of the table contains an aggregated value for the metric in the respective table column (e.g., the total number of files in the directory and all sub-directories).
Configure Table The button opens a dialog that lets you change which metrics are shown in the table, how they are assessed, and in which number format they are presented (see detailed guide).
Link The button adds a link to this view to the clipboard. The link also encodes the settings applied to the table.
Add metric The Issues and Spec items pages allow to add new metrics by clicking the button.
In addition, when you start to browse deeper into the directory structure of your code base, you will encounter two additional elements:
Bread crumbs The bread crumbs show the current position in the code hierarchy, i.e. the current directory in a file system-like structure. Clicking them navigates to ancestor folders of the hierarchy. The Metrics Overview Table shows the content of the current directory.
View Findings Button A click on
View Findingswill show you all findings stemming from the files you are currently viewing.
Action: Navigating the Test Gaps
As mentioned before, each of the tables in the Metrics perspective - Code, Architectures, Custom Artifacts - can be used as a starting point to navigate deeper into the respective directories. Clicking on a directory will update the Metrics Overview Table with the content inside the selected directory. Clicking on a file displays its code in the Code Detail View. Navigating back to a top folder can be done by the bread crumbs.
While navigating the code structure, the Metrics Overview Table can also be configured. You can click a column head to sort all entries according to the metric values in the corresponding column. For example, you can sort directories and files by their size in lines of code. You can also configure which metrics are shown in the table (see here). Which metrics are available depends on the analysis profile which is configured in the Projects view.
The table combines the directory structure with change information from its history. The column Last Change Date shows you when the respective directory or file was changed last. By clicking the value in column, you jump to the Activity perspective and the corresponding activity, i.e. the corresponding commit, is shown.
You can also view each directory at a specific point in time. Use the Timetravel feature to choose a date, baseline or revision. The content of the directory will be updated to the selected timestamp.
When you are browsing through your source code, it is possible to view all findings for the directory currently visible. Simply click View Findings above the table or press »F«. All findings for the current directory will be displayed in the Findings perspective.
Action: Configuring the Metrics Tables

Number Formatting: The checkbox in the Number Formatting area allows you to switch whether numeric values should be shown in full (e.g., 1,200) or whether they shall be rounded using appropriate SI prefixes (e.g., 1.2k).
Threshold Profile: The threshold selector lets you choose which of the configured threshold configurations should be used to assess metric values. You can create and edit threshold configurations in the Metric Thresholds view.
Metrics to show: Simply check all metrics that should be presented in the table. To quickly find a metric, you can use the search bar above the list. Note that you can also quickly remove table columns by hovering over a column head and clicking the »x« that will appear in the top-right corner.
Which metrics are available depends on the analysis profile which is configured in the Projects view.
Viewing Metric History and Distribution
For each available metric, you can view its history trend, as well as a treemap that visualizes the metric distribution across all (code) files. To view them, click on a table cell showing a particular metric. This will display the history and the treemap of the metric:
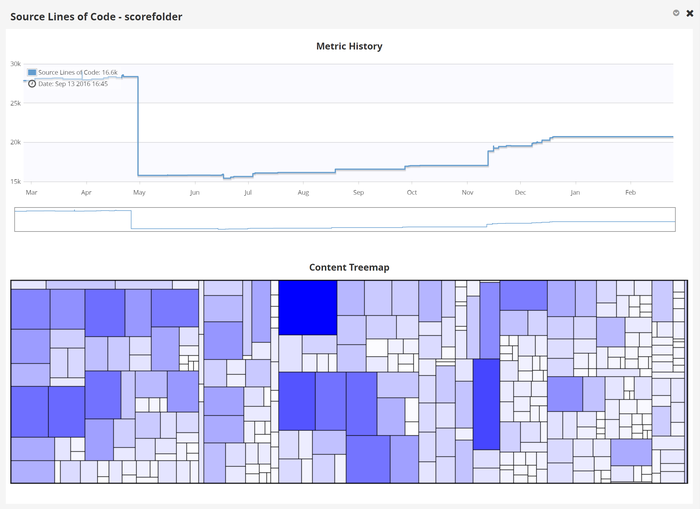
For the history trend, a time range can be selected and viewed in Delta Perspective by clicking the arrow and choosing option View selected range in Delta Perspective from the context menu. A click on a rectangle in the treemap lets you view the respective file in the Code Detail View.
Action: Viewing a Code File
Often, browsing a directory or component structure ends when a certain source code file was found. Each code file can be viewed in the corresponding Code Detail View.