Troubleshooting Known Issues
This page collects known problems that you might encounter when working with Teamscale along with their respective solutions. We have grouped issues occurring in SAP systems when connecting with Teamscale on a separate page: Troubleshooting SAP System Connections
Teamscale Does Not Start: Web Interface Is Not Reachable
You are trying to start Teamscale, but the web interface (usually located at http://localhost:8080) is not reachable.
Check the log files: There are several locations where logs are written that may contain helpful information about why Teamscale is not starting:
- Directory
logsin the Teamscale working directory. - If Teamscale is installed as windows a service:
windows/*.log - The logging facilities of the service executing Teamscale:
docker logsorjournalctlfor systemd units.
If you are unsure which entries in the log file are related to the startup problem, you can rename the old logs, then restart Teamscale. It will automatically create new log files.
Check your JAVA_HOME setting: If you have recently updated Java, please ensure that JAVA_HOME points to the right directory. If you're running Teamscale as a service, please also check the relevant service configuration files under TEAMSCALE_INSTALL_DIR/windows and TEAMSCALE_INSTALL_DIR/linux.
Disable SSL: If you have SSL enabled, please try commenting out all options starting with https in config/teamscale.properties to temporarily disable SSL. If this works, you now know that a faulty SSL configuration is causing the startup problems.
Access Teamscale via localhost: While debugging startup problems, test Teamscale's availability by accessing it via localhost on the machine where it is installed. If this works but accessing it via the server/hostname does not, you now know that a network problem (firewall, missing connectivity) is causing Teamscale to not be available.
Run Teamscale manually: If you are running Teamscale as a service, try running it via teamscale.sh or teamscale.bat instead. If this works, you now know that there is a problem with your service setup (e.g. running as a different user with missing permissions or path misconfiguration).
Teamscale cannot be accessed: Invalid SNI
The behavior you see is an intended security mechanism that verifies that the certificate matches the host name. If you still want to allow non-matching certificates, this can be achieved by setting the -Dcom.teamscale.ssl.skip-sni-host-check=true JVM property in config/jvm.properties.
Although this property works around the issue, we strongly recommend setting up the proper certificate instead.
Teamscale shows a blank page when accessing through a Reverse Proxy
If attempts to access Teamscale via a reverse proxy, such as NGINX, result in a blank page, it's probable that the reverse proxy isn't configured appropriately. You might find it helpful to inspect your browser's console for potential issues. To access the console, follow the steps outlined in this guide, which provides instructions for various browsers. Should an error like Content-Security-Policy: default-src 'self'; connect-src ...; appear in the console, it's a strong indication that the NGINX configuration needs adjustment.
For assistance in configuring the reverse proxy, kindly refer to our guide on Accessing Teamscale via Reverse Proxy. Please pay close attention to the X-Forwarded-... headers; they need to be accurately set to reflect the URL schema, domain, port, and path prefix of how Teamscale is exposed to the user.
Teamscale redirects to an internal URL when accessing through a Reverse Proxy
If attempts to access Teamscale via a reverse proxy, such as NGINX, result in an immediate redirect to an NGINX internal URL, it's very likely that the reverse proxy isn't configured appropriately.
For assistance in configuring the reverse proxy, kindly refer to our guide on Accessing Teamscale via Reverse Proxy. Please pay close attention to the X-Forwarded-... headers; they need to be accurately set to reflect the URL schema, domain, port, and path prefix of how Teamscale is exposed to the user.
Teamscale Does Not Start: Invalid maximum heap size: -Xmx4096m
When starting Teamscale fails with an error message like Invalid maximum heap size: -Xmx4096m, this is most likely caused by using a 32-bit Java Virtual Machine (JVM). Teamscale requires a 64-bit JVM.
Teamscale Does Not Start on Macs with Mx CPU (ARM): Incompatible Architecture
When starting Teamscale on macOS fails with an UnsatisfiedLinkError and the error message contains the text mach-o file, but is an incompatible architecture (have 'x86_64', need 'arm64'), this indicates failure in loading the LevelDB library. This is because LevelDB is not supported on ARM-based Macs and you will need to switch to a RocksDB or Xodus database for Teamscale to start. You can do so by changing the database.type option in the teamscale.properties file as described here.
Teamscale Docker Container Does not Start: 'ERROR: JAVA_HOME is not set and no 'java' command could be found in your PATH
When the Teamscale Docker container fails with an error message like ERROR: JAVA_HOME is not set and no 'java' command could be found in your PATH, this is most likely caused by a too old docker version. Teamscale requires Docker 20.10.10.
Lost Administration Access
In case no user with administrator privileges can log in anymore, you can restore the default admin account. Start Teamscale with the JVM property -Dcom.teamscale.force-create-admin. This will recreate the default admin account, so you log in again as admin using the default password admin. The default admin account will be deleted on the next backup import.
Teamscale Runs Into Memory-Related Problems
If you face a memory-related problem in Teamscale, this section may help you remedy the issue.
Problem Description
Teamscale is running out of memory while fetching data or analyzing the code (often after a drastic slow-down due to the JVM trying to free memory) . A line similar to this one appears in the log files or the worker log:
java.io.IOException: java.lang.OutOfMemoryError: Java heap spaceAddressing the Memory Problems
First: Exclude all Generated Code Requires Re-Analysis
The main source of problems when Teamscale runs out of memory is when the clone detection tries to find clones on large chunks of generated (often highly similar) code. Therefore, the first solution should be to exclude any generated code in the project you are analyzing. For that, you will need to edit the configuration of the affected project.
Using path patterns:
For example, to exclude all code that lives in the folder
gen-src, use the following exclude patterns on the Excluded File Names project setting:**/gen-src/**The exclusion patterns are regular ant include patterns
Using file content patterns:
If excluding code by using directory structures does not work, you can use the advanced field Content Exclude. Use this to exclude files by their content, using regular expressions. For example to exclude all files that contain the documentation string
generated by Visual Studio, add the pattern:.*generated by Visual Studio.*
Re-Analysis Required
Please note that changes to these project options will require a re-analysis of the project.
Second: Adjust Memory Settings Requires Restart
If you have excluded all your generated source code and Teamscale still runs out of memory, you can adjust the amount of memory used by Teamscale.
Reserving Additional Memory
You can adjust the JVM_MEMORY parameter in $TEAMSCALE_HOME/config/jvm.properties. See CPUs and RAM for how to determine the right amount of memory for your setup.
Reducing the Number of Workers
If your Teamscale server does not have more memory that ought to be reserved, you can also adjust the number of workers that Teamscale should use. This can be done in the teamscale.properties (config folder) via the engine.workers property.
Performance Impact
Note that this will likely slow down the analysis, as Teamscale can parallelize less processes.
See CPUs and RAM for our recommendation on how much memory to reserve per worker.
Third: Limiting concurrent executions of system processes Requires Restart
If Teamscale still runs into memory problems, another cause could be external processes requiring too much memory, leaving not enough for the JVM.
Background
Some Teamscale features require the execution of processes outside the JVM, e.g. Clang-tidy, Cppcheck or Swiftlint. Teamscale cannot limit the amount of memory consumed by these tools. If the underlying server is already close to its memory limits and then lots of these tools are run in parallel, it could be that there is not enough memory available for Teamscale anymore.
Limiting the number of concurrent executions
In order to limit the number of external processes started by Teamscale, set the system property com.teamscale.external-process.maximum-concurrency to your desired value.
Performance Impact
Note that this will likely slow down the analysis, as Teamscale can parallelize less processes.
As a rule of thumb, we recommend using the number of configured workers. If Teamscale still runs out of memory, try adjusting the value to a lower number.
Still Experiencing Problems?
In case Teamscale's analysis is still affected by out-of-memory problems, please don't hesitate to contact our support.
Analysis is Slow
There are several factors that may influence Teamscale's analysis performance:
Insufficient IO Throughput
Teamscale's analyses are mostly IO-bound, meaning the higher the throughput of your hard disk, the faster the analyses will run. This is the single factor that influences Teamscale's overall performance the most. In case you are experiencing unsatisfactory performance, please measure the performance of your hard disks and compare it to our reference table.
For this reason, we generally recommend running Teamscale on local SSDs, not on network-attached storage.
Virus Scanner
Many virus scanners are known to have a severe negative impact on the performance of Teamscale's analyses. Slowdown may be up to 100%. Thus, we recommend you place the following directories on your virus scanner's allow list, i.e., to exempt them from scanning:
- Teamscale's Installation Directory: The directory where you installed Teamscale.
- Database Directory: By default, this will be the
storagedirectory within your Teamscale installation directory. However, this location can be changed by setting thedatabase.directoryproperties in yourteamscale.propertiesconfiguration file.. - Process Working Directory: This will contain e.g. clones of analyzed Git repositories. Which exact directory this is depends on which directory you start Teamscale from. In many cases, this will be the same as Teamscale's installation directory. However, this can be changed by configuring the Docker installation, service definition file or startup scripts (depending on how you installed Teamscale).
- Teamscale Working Directory: This is configured in your Teamscale instance under Admin > Settings > Server Settings. If you did not explicitly configure this, it will be a subdirectory of the system temp directory. This contains certain temporary files that are created during the source code analysis.
- JVM Temp Directory: Used for temporary files created outside the source code analysis. By default, this will be the temp directory used by your operating system (On Windows:
%USERPROFILE%\AppData\Local\Tempfor user processes andC:\Windows\Tempfor services; on macOS/Linux:/tmp). However, this location can be changed by adding a-Djava.io.tmpdir=...argument to theJVM_EXTRA_ARGSvariable in yourjvm.propertiesconfiguration file.
Some virus scanners also have the option to white-list certain processes. In this case, we recommend you additionally white-list java.exe and all child-processes it creates.
Trend Micro
Recent versions of Trend Micro can cause significant performance degradation unless configured exactly as specified above. The configuration option with the biggest impact on Teamscale performance is to white-list java.exe. Directory excludes alone will still result in bad performance.
Insufficient Database Cache
The default setting for Teamscale's database cache is meant for small to medium instances. For large instances, you will need to increase the database cache. This will usually provide a moderate speed-up of the analysis and a significant speed-up of hot-path queries to the API and web interface (e.g. often-used dashboards).
Jira Does Not Render Teamscale Annotations Correctly
Teamscale can annotate Jira tickets with the finding/test-gap information aggregated over commits for that ticket. This can be enabled in the Jira connector in the project settings.
If it looks like in the following screenshot, Jira does not render the markdown content correctly:
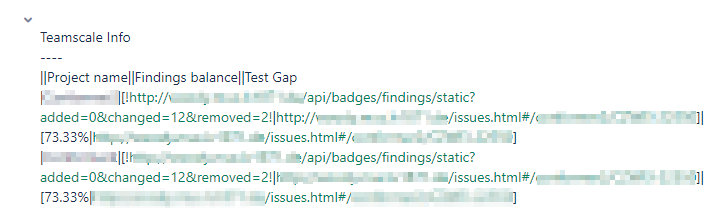
This problem can be solved by configuring Jira to the wiki style renderer:
- Log in to JIRA as a JIRA administrator.
- Navigate to Administration > Issues > Field Configurations.
- Click on the Configure link for the field configuration used by the field to which Teamscale writes.
- Click on the Renders link for the field to change.
- Select the new renderer type from the Active Renderer drop-down list. Select the Wiki style renderer.
- Click on Update to apply the change.
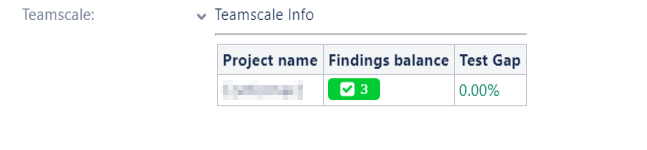
Afterwards, Teamscale's annotations in Jira ticket should be rendered properly:
Teamscale Login does not work when embedded in an iframe
Some use cases might make it necessary to show Teamscale within an iframe for example to embed it within the dashboard of another web application like Jira. This means that requests within the iframe are performed cross-site as the site name of Teamscale does not match with the site of the containing page. Modern browsers only allow sending cookies cross-site if they are transmitted over a secure connection. Therefore Teamscale must be accessed via HTTPS to work correctly within an iframe as its login mechanism uses cookies. When you terminate HTTPS not directly within Teamscale, but at the load balancer e.g. nginx, Teamscale needs to be made aware of this fact.
This can be achieved by configuring your reverse proxy to pass the header X-Forwarded-Proto: https to Teamscale. This enables the Secure attribute from login cookies even if no HTTPS was configured within Teamscale.
WARNING
Your browser needs to be configured to accept cookies from third party sites, which is the default setting unless overridden by e.g. corporate group policy rules. E.g. in Chrome this setting is called Block third-party cookies under Cookies and other site data.
If the setting is enforced the only workaround is manually specifying the site holding the iframe as exception under Sites that can always use cookies. Ensure that Including third-party cookies on this site is enabled.
Cross-Site-Request-Forgery (CSRF) Errors
If access to a Teamscale instance is being managed by an external server such as NGINX (which is a recommended practice), it may be necessary to adapt the header settings to accommodate the cross site request forgery guarding mechanisms built into Teamscale. Specifically, this is the case when an error message appears containing the text X-Requested-By header is missing.
To fix this, insert the following line in your NGINX configuration file at the appropriate place (e.g., the server you want to configure):
add_header 'Access-Control-Allow-Headers' 'X-Requested-By';Another possible cause could be that you have configured your NGINX to rewrite the session cookie to a HttpOnly cookie. To solve this issue, remove the HttpOnly option in your NGINX configuration:
# WRONG: This configuration breaks the CSRF protection mechanism
proxy_cookie_path / "/; Secure; HttpOnly; SameSite=None";

# CORRECT: The configuration should not add the HttpOnly flag
proxy_cookie_path / "/; Secure; SameSite=None";
Please refer to this post for details.
Vsix-Installer Crashes When Manually Installing Teamscale's Visual Studio Extension
When installing the Teamscale Visual Studio Extension in Visual Studio 2015 on Windows 10, a XamlParseException similar to following error may occur:
System.Windows.Markup.XamlParseException was unhandled
Message: An unhandled exception of type 'System.Windows.Markup.XamlParseException' occurred in PresentationFramework.dll
As a workaround, the extension can be installed manually via the command line as follows:
\path\to\visualstudio\Common7\IDE\VSIXInstaller.exe /q <YOUR-TEAMSCALE_EXTENSION.vsix>TransportException: Object too large When Using Git Connector
The Git connector reports this error when a Git repository that contains a file larger than 2 GB is connected to Teamscale. This is due to internal limitations of the Java Git implementation, which unfortunately cannot be circumvented.
A possible workaround is to clone the repository with a native Git client, which doesn't have this limitation, and then exclude the problematic file from Teamscale analysis:
- In the workspace directory, execute
git clone --bare $REPO_URL. - Add the Git connector to the Teamscale project in question.
- When configuring the Git connector, use the Excluded file names option to exclude the respective file from analysis.
Another option is to remove the offending file from the history of the Git repository entirely, e.g., if it was added by accident. This StackOverflow question has some pointers on how to perform such an operation.
LargeObjectException: Encountered large object When Using Git Connector
The Git connector reports this error when a file larger than 50MB is read from Git. It is recommended to exclude the file from analysis using the Excluded file names option in the Git connector.
If you need to analyze the file, e.g., when reading coverage reports from Git, specify a higher threshold (in MB) using the JVM argument -Dcom.teamscale.git-largefile-threshold-mb.
Some URLs Do Not Work When Running As Azure App Service
Azure App Service runs your application behind a proxy server. By default, this proxy will filter certain URLs, which can lead to pages not loading correctly in Teamscale. For example, all URLs ending in .cs are blocked by default.
To resolve this, you need to adjust the web.config file in the root of your App Service similar to the following example:
<?xml version="1.0" encoding="UTF-8"?>
<configuration>
    <system.webServer>
        <handlers>
            <add name="httpplatformhandler" path="*" verb="*"
                 modules="httpPlatformHandler" resourceType="Unspecified"
                 requireAccess="Script" />
        </handlers>
        <httpPlatform stdoutLogEnabled="true" startupTimeLimit="300" startupRetryCount="0"
                      processPath="%SystemRoot%\System32\WindowsPowerShell\v1.0\powershell.exe"
                      arguments="%home%\site\wwwroot\HttpPlatformHandlerStartup.ps1">
        </httpPlatform>
        <security>
            <requestFiltering>
                <hiddenSegments>
                    <clear />
                </hiddenSegments>
                <fileExtensions>
                    <clear />
                </fileExtensions>
            </requestFiltering>
        </security>
    </system.webServer>
</configuration>
Wrong Version of clang-tidy (or LLVM)
Teamscale can execute clang-tidy on your C/C++/Objective-C source code and manage the reported findings. Our docker images already come with a clang-tidy binary in the correct version. With all other distributions, you need to install clang-tidy 21.1.3 on the Teamscale server. We require this exact version since the checks and check descriptions supported by clang-tidy are stored in Teamscale (the clang-tidy binary has no option to print all descriptions). We expect clang-tidy to be available as clang-tidy-21 in the PATH. Alternatively you can specify the path to the executable via the com.teamscale.clang-tidy-exe JVM property.
Automatically Check the Clang Tidy Setup
Teamscale offers a REST service to verify whether clang-tidy is correctly installed: <TEAMSCALE_URL>/api/verify/clang-tidy-setup.
Wrong Version of PSScriptAnalyzer
Teamscale can execute PSScriptAnalyzer on your PowerShell source code and manage the reported findings. This feature requires that PSScriptAnalyzer 1.21.0 is installed on the server. We require this exact version since the checks and check descriptions supported by PSScriptAnalyzer are stored in Teamscale. Our docker images already come with a PowerShell binary and an installed PSScriptAnalyzer. With all other distributions, you need to install PowerShell and PSScriptAnalyzer version 1.21.0 on your Teamscale server. We expect PowerShell to be available as pwsh in the PATH. Alternatively you can specify the path to the executable via the com.teamscale.powershell-exe VM property.
Automatically Check the PSScriptAnalyzer Setup
Teamscale offers a REST service to verify whether PowerShell and PSScriptAnalyzer are correctly installed: <TEAMSCALE_URL>/api/verify/powershell-script-analyzer-setup.
Wrong Version of cppcheck
Teamscale can execute Cppcheck (open source) on your C/C++ source code and manage the reported findings. With a corresponding license, you can also use Cppcheck Premium.
Our docker images already come with binaries for both versions of Cppcheck (open source and Premium). With all other distributions, you need to install the tools on the Teamscale server. Teamscale requires cppcheck-2.18.0 (open source) or version 25.8.3 (Cppcheck Premium).
Automatically Check the Cppcheck Setup
Teamscale offers a REST service to verify whether cppcheck is correctly installed: <TEAMSCALE_URL>/api/verify/cppcheck-setup.
Teamscale Dashboard cannot be accessed: 404 Not Found
You are trying to access an existing Teamscale Dashboard, but Teamscale responds with the 404 Not Found error.
Check NGINX reverse proxy configuration:
NGINX reverse proxy has the property of changing the encoding of URIs that are handled by the proxy_pass or rewrite directives in many cases. This can manifest in incorrect URIs that may be handled in an unexpected manner by the Teamscale routing framework. For example, the slash in userName/dashboardName used regularly when storing dashboards will be interpreted as a structural delimiter by the routing framework instead of a part of the path parameter if it is not given in the URL with a proper encoding. This will result in 404 Not Found errors, since the routing framework is unable to locate a matching service endpoint. Use the suggested NGINX configuration to remedy the problem.
No users can be assigned to Quality Control Tasks
You have created a new task in the Tasks view, but you cannot set the "Assignee" field to the correct user, as the user is not listed in the selection.
To be able to set the "Assignee", you need "View" permissions on the user who you would like to assign. You can achieve this in the following ways:
- An administrator adds you and the assignee to the same user group.
- An administrator adds "View" permissions for your user or user group in the Admin > Users or Admin > Groups views to be able to access the user or user group of the assignee.
- An administrator adds a Global Role Assignment for your user or user group in the Admin > Roles view to be able to access all users (setting the "User" domain and the "Viewer" role).
SAP Connection: The SAP JCo library has not been loaded
You are trying to connect Teamscale to your SAP systems, but the settings page Admin > Settings > SAP shows the warning "The SAP JCo library has not been loaded". Also, System > System Information shows SAP JCo version as "not loaded" in the Java VM section.
Make sure you followed the installation instructions. If the issue is still not resolved, check the Teamscale log file at logs/teamscale.log for further information, or send us a support request for further assistance.
SAP Connection Does Not Import New Code Anymore
If one of your Teamscale projects does not show current ABAP code changes from your SAP system anymore, this section may help you remedy the issue. As a general recommendation, please make sure you are running the latest versions of both Teamscale and the Teamscale Connector for SAP NetWeaver® AS ABAP®.
Problem Description
Teamscale does not show recent ABAP code changes for one of the SAP systems connected via the Teamscale Connector for SAP NetWeaver® AS ABAP®. The most recent commit shown in the Activity perspective does not reflect current changes in the system.
Inspecting the Worker Log
The first thing to inspect is the worker log. In the System perspective, select the Worker Log entries for Maintenance Jobs and enter abapsystem into the Regex field:
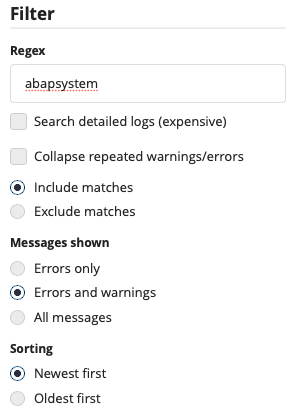
Then click on the most recent error entry, and inspect the detailed log message.
Error: Crash in the SAP system
Under certain conditions, the export in the SAP system can fail.
Symptom
The worker log entry contains a line like
RfcException raised by system [CQR|abap-rel|00]:This means that an error occurred in the SAP system. In this case, we need more information from the SAP system.
Gathering Further Information
- Note the time the error was logged in the worker log.
- Log on to the SAP system using SAPGui.
- Open transaction ST22 and search for short dumps caused by the Teamscale user at the time noted in step 1.
- Export the short dump into a text file
- Send the file to support@teamscale.com or request a link to perform an HTTPS-secured upload
- Our experts will investigate the reason for the crash and provide you with mitigation instructions
Possible Reasons
There are a number of different things that can cause a code export to crash. Of course, our SAP connector heavily relies on SAP standard functionality. Sometimes these standard routines do not handle edge cases very well, which might lead to crashes. Our exporter does have extensive error handling functionality, but some conditions cannot be handled programmatically, but immediately lead to a dump, e.g. violation of ASSERT conditions, or unbound field symbols, to name just two.
These conditions can occur e.g. when Code Inspector is executed for an object with rarely used syntax, when DDIC information or function groups have become inconsistent because of some previous error condition unrelated to Teamscale.
Workarounds
Depending on the cause for the crash, there are different mitigation strategies to disable certain functionalities of the SAP Connector, so that the condition causing the crash does not occur anymore. You may search the call stack for the last code block belonging to the /CQSE/ namespace in order to locate the export step the error is related to, e.g. Code Inspector checks or DDIC export.
Code Inspector
In case of Code Inspector crashes, you may search the short dump for the value of the variable OBJECT_NAME to identify which object Code Inspector was checking when it crashed. Then, have a look at the ABAP code in your favorite ABAP editor, and try to check it manually using Code Inspector. If the check fails, you have the following options:
- Adjust your ABAP code so that Code Inspector can successfully run the check
- Search for an SAP Note fixing the check (e.g. Note 2215785, requires login)
- In the SAP system, disable the particular check in the check variant that is used by Teamscale
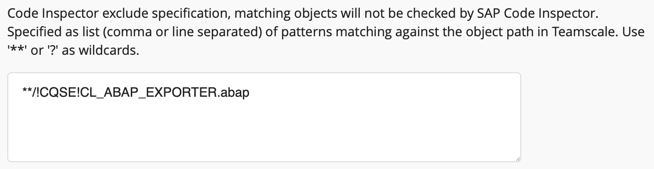
- Add the particular object to the Code Inspector exclude specification in Teamscale's SAP connection settings for the respective system to exclude it from Code Inspector checks. Be sure to use the object name as shown in Teamscale:
DDIC Export
In case the crash is related to the DDIC export, you may search the short dump for strings such as OBJECT_NAME, OBJ_NAME, PROG_NAME, or PROGRAM_NAME to determine which DDIC object caused the crash. Then, open the respective DDIC object with SAPGui and run consistency checks (e.g. to identify broken foreign-key relationships in database tables). Workarounds are:
- Fix the inconsistencies in the respective DDIC object
- Disable the option Include objects in ABAP Dictionary (DDIC) in Teamscale's SAP connection settings for the respective system
Error: Timeout
Similar to crashes related to programming errors or data inconsistency, in some cases the RFC connection to the SAP system may be terminated due to a timeout in the SAP system.
Symptom
The worker log entry contains a line like
RfcException raised by system [CQR|abap-rel|00]:
message: Zeitlimit überschritten
Solution
Please make sure that
- The SAP user configured in Teamscale is not a dialog user (see RFC User for Teamscale)
- You use background full sync if Code Inspector is enabled (see Background Full Sync)
If the problem persists, please:
- Perform an ABAP trace and/or an SQL trace on your system during export
- Send the results to support@teamscale.com or request a link to perform an HTTPS-secured upload
- Our experts will investigate the reason for the timeout and provide you with further instructions
Error: SAP Connection fails with error "CCA is not filled yet. Too early to run ATC check"
In some cases, the SAP system can't execute ATC checks. The error aborts the Teamscale Exporter in the SAP system, so Teamscale does not get updates (code changes, SCI findings).
Symptom
The worker log entry contains a line like
JCO_ERROR_SYSTEM_FAILURE: CCA is not filled yet. Too early to run ATC checkSolution
The problem and its correction are described in SAP Note 3242711 (requires login). Please make sure this note is implemented in your SAP system.
Test coverage is missing in Teamscale
To narrow down the problem please check the following:
Check the status information of the upload
Navigate to the Project Configuration perspective. Select the Projects view and click on the icon for the project that is missing coverage. Now in the External Uploads View, expand the partition of the upload and search for the commit. Be aware that the date and time refers to the code commit for which the coverage has been uploaded, as opposed to the time at which the upload happened. If you can't find the commit, something must have gone wrong during the actual upload. In this case, please have a look at the Service Log in the System perspective and check our upload script output or tooling logs, depending on how the upload is executed. Otherwise, click on the commit to see all the details for the upload. It lists all the state transitions of the upload and provides hints when something went wrong. The last state should be PROCESSED.
Check the worker logs for related warnings and errors
Next you might want to check the Worker Log in the System perspective. Open the worker log for your project. Select Errors and warnings and search for entries related to the upload commit e.g., by searching for the timestamp with the Filter option. Click on the entry to see all the log messages.
Check whether the coverage report actually contains coverage information
Make sure that there are parts in the report that actually contain covered lines or instructions. This of course depends on the concrete report format.
JaCoCo reports have line tags like <line nr="7" mi="8" ci="0" mb="0" cb="0"/> where mi means missed instructions and ci means covered instructions. If the coverage file only contains ci="0" entries, something must be wrong with the profiler configuration. In this case, check your include and exclude patterns and that no additional class file transformations happen at runtime e.g., by another java agent. You might also find the Teamscale JaCoCo Verifier helpful to find out whether the XML file actually contains relevant coverage.
Teamscale Java Profiler
You have attached the Teamscale Java Profiler to your application according to the documentation but you are not seeing the coverage you expected or maybe even no coverage at all.
Always Check the Logs
The first step in troubleshooting such problems is always to look at the log file the agent writes at AGENT_INSTALL_DIR/logs. If it contains any errors, please resolve these first. Examples are network connectivity issues or incorrectly configured command line arguments.
It also tells you whether the agent was started at all since the agent will always log at least an INFO entry at startup.
First, we'll verify the most basic setup: The agent must at least start and write coverage files to disk. Please remove all options starting with teamscale- and the out option. This allows you to inspect the coverage reports. Coverage is written to AGENT_INSTALL_DIR/coverage. Please ensure that the agent can create files inside this directory.
Please disable all other -javaagent and -agentlib arguments to your JVM to avoid interference of other agents with the Teamscale Java Profiler.
Re-run your application and then shut it down. Coverage files are always written on shut down of the application.
- A coverage file must be created in
AGENT_INSTALL_DIR/coverage. - If not, please check the agent's logs in
AGENT_INSTALL_DIR/logs. - If no logs were created, then the agent was not started. Please re-check your configuration and the logs of your own application.
No Coverage Data is Generated at All
Problem: Your Application Is Not Shut Down Gracefully
If no coverage file was created or the coverage file is truncated (i.e. does not end with </report>), then it may be that your JVM did not shut down gracefully. Please ensure that no other process is forcefully killing your JVM, e.g. a service running, Docker, an application server etc.
Coverage Files Can Be Generated But Upload to Teamscale Fails
If a coverage file was written but upload to Teamscale fails when configuring the teamscale- options, please verify that the server where the agent is installed can reach the Teamscale server.
Problem: Your Servers Cannot Reach Each Other
On the agent's server:
- Run a
pingof the IP address of the Teamscale server. - Run
curl -v TEAMSCALE_URL/loginand check for connection problems. Teamscale must respond with the login page's HTML, HTTP status 200. - Ensure that no firewalls or reverse proxies are causing issues.
- If a proxy is required, please configure the proxy for your JVM so the agent can use it.
Problem: You Provided the Wrong Authentication Information
If a network connection is possible, common mistakes that prevent an upload to Teamscale are:
- The
teamscale-useryou provided does not have the Perform External Uploads permission in Teamscale. - You provided the
teamscale-user's password instead of their access token in theteamscale-access-tokenoption.
Coverage Uploads Are Shown In Teamscale But Coverage Is Missing
You can see the coverage uploads as Processed in Teamscale under Project Configuration > . You can also see the upload under Activity. However, when you click on that upload in Activity, either all or some coverage is missing when you check the list of covered files.
Problem: Your Include/Exclude Patterns Are Misconfigured
Please run the agent with patterns that include all code:
includes=*
excludes=
Run your application and upload coverage to Teamscale again If you now see the missing coverage, then your previous include/exclude patterns were not configured correctly and were excluding the code you wanted to profile.
Problem: You Are Profiling the Wrong Process
The profiler will only profile the code running within the JVM which receives the -javaagent argument. I.e. if your main Java process spawns another, it must pass on the -javaagent argument to the child process or the code running in the child will not be profiled.
Please ensure that the JVM that is running the code you wish to profile actually receives the -javaagent argument, e.g. with a process explorer tool that can show the command line of a process.
Problem: Interference by Another Java Agent
Other Java Agents can disrupt the Java Profiler in a way that prevents it from instrumenting your classes. Please disable all other -javaagent and -agentlib arguments to your JVM. If this resolves your issue, you have two options:
- either leave the other agent disabled while you collect coverage
- or try to reorder the agents so the Teamscale Java Profiler's
-javaagentargument is the first such argument on the JVM's command line. In many cases, this will also resolve the conflict.
Teamscale Integration for Eclipse
Enabling Debug Logging
In order to determine the root cause of the problem, we may need debug logs from your Eclipse installation. To enable debug logging, open the Preferences and navigate to General > Tracing. There, check Enable tracing and search the Tracing options for Teamscale. Set the desired options to true. (If in doubt, set all options offered by the Teamscale Integration for Eclipse to true.) Finally, take a note of the path given for the Output to file option: This is where you can later access the log file. Apply your changes and close the dialog.
Then, please reproduce the problem in the open IDE window. Afterwards, locate the log file and send it to CQSE support for analysis.
Cannot Install Eclipse Integration
Problem: Installation Complains Cannot Perform Operation
When Eclipse complains that Cannot perform operation. Computing alternate solutions [...] during installation of the Teamscale Integration, wait and then proceed to the Install Remediation Page. If that page does not offer a solution, go Back and refine the set of plug-ins to install. The Diagnostic Support plug-in, in particular, has been known to cause the above error when doing an offline installation and the Equinox Dynamic Tracing Enablement UI (org.eclipse.ui.trace) plug-in is not already installed.
To solve the issue, please only install the Teamscale Integration for Eclipse itself; everything else is optional.
Teamscale Integration for IntelliJ
Enabling Debug Logging
In order to determine the root cause of the problem, we may need debug logs from your IntelliJ installation. To enable debug logging, go to either Help > Debug Log Settings… or Help > Diagnostic Tools > Debug Log Settings…, depending on your IntelliJ version. Then, enter the following log categories, one per line:
com.teamscale.ide.intellij:trace
#com.teamscale.ide.intellij:trace
Save your changes and close the dialog.
Then, please reproduce the problem in the open IDE window. Afterwards, you can access the log files under Help > Show Log in Files and send them to CQSE support for analysis.
IntelliJ Integration Forgets Server Settings
When the Teamscale Integration for IntelliJ "forgets" the Teamscale Servers configured on the Tools > Teamscale settings page upon an IDE restart, this may have several causes.
Problem: Do Not Save, Forget Passwords After Restart Selected
The Do not save, forget passwords after restart option is selected on the Appearance & Behavior > System Settings > Passwords settings page. In this case, please select another option.
Problem: Native Keychain Does not Work With Gnome Keyring
If In native keychain is selected and you are using the Gnome Keyring, you may be experiencing a bug in the IDE itself (issue IDEA-247162). As a workaround, please select the In KeePass option.