Monitoring & Assessing Quality Evolution
An essential part of software intelligence comprises monitoring your quality evolution and drawing the right conclusions from it: when something goes wrong, panic and over-the-top decisions are usually the opposite of helpful. Instead, Teamscale provides a transparent root-cause analysis. Based on these results, you can derive reasonable and specific counter measures. This section shows how Teamscale supports the role of a quality-engineer in a quality-control-like process. In this context, quality control refers specifically to code quality control.
Inspecting Recent Metric Trends
Monitoring quality evolution often starts with the questions:
In which direction are we heading?
Is there a trend to get better or are we doing worse?
As Teamscale has the entire history available from the underlying repository, it can provide transparent and understandable answers.
For every metric you have configured, Teamscale offers you to inspect it as a trend chart. It can compute this trends over any selected period within the history that Teamscale has available. To view quality trends for your system, go to the Dashboard perspective and select the button in the right sidebar. If you choose Create From Template , you can give the dashboard a name and select the overview dashboard template as well as your specific project. The dashboard gives you an overview of your quality, but it also shows you in which direction you are heading: Metric that consist only of one numeric values, such as lines of code, clone coverage and findings count are displayed with a numeric metric value widget. This widget shows both the absolute value as well as the trend over the last 7 days as default:

If the trend is positive, the delta in the metric value will be marked as green, see the decreasing clone coverage in the screenshot. In contrast, if the trend is negative, the delta will be marked in red.
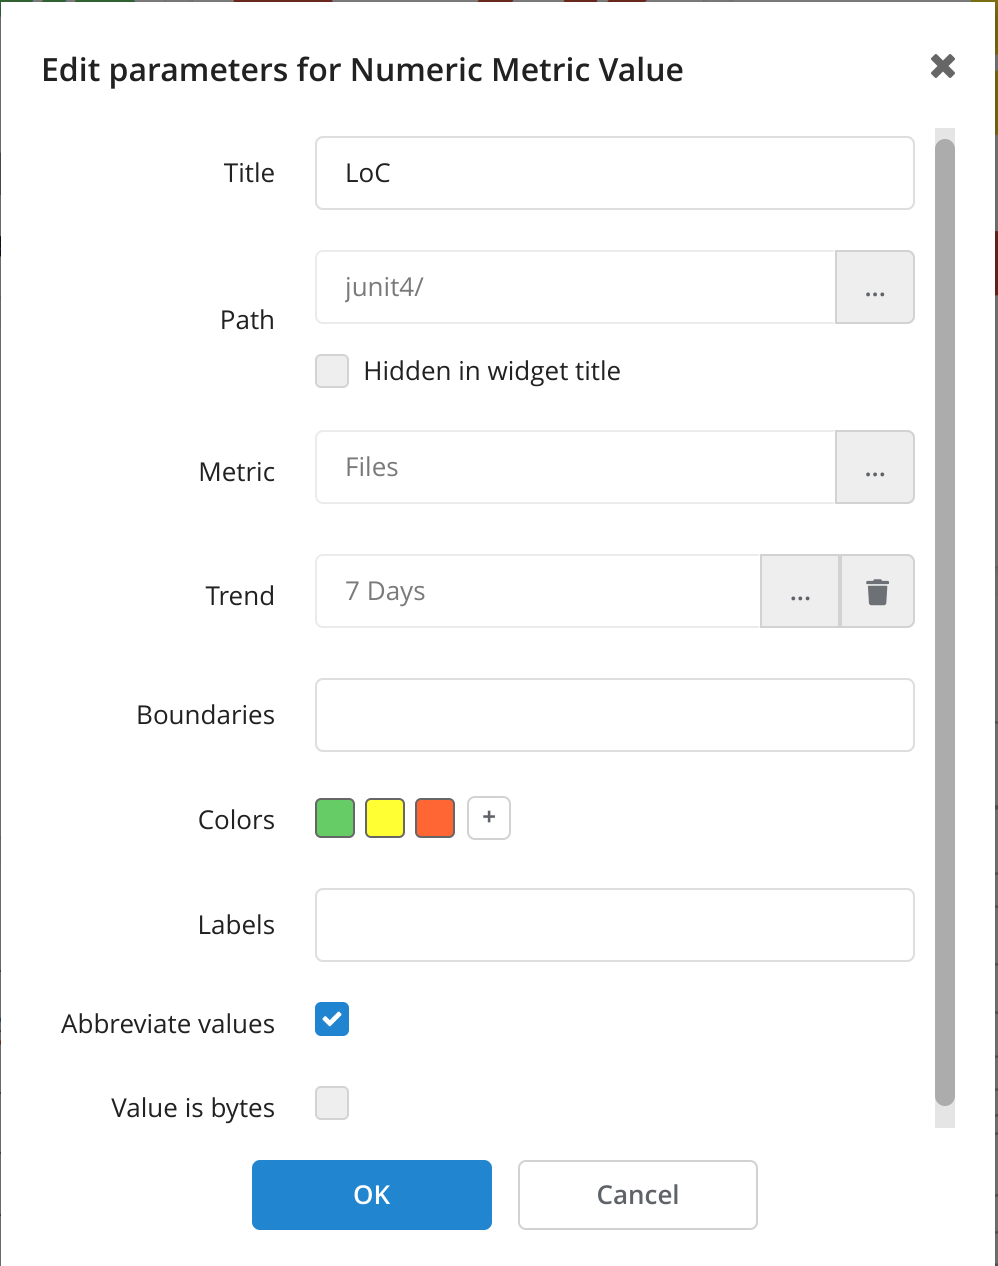
To change the length of the considered trend interval, you can click on the right arrow next to your dashboard's name in the right sidebar and select Edit Dashboard . Each widget displays a configure button () in the top left corner. Click on it and the Edit Parameters dialog will open in which you can set the duration of your trend interval:.
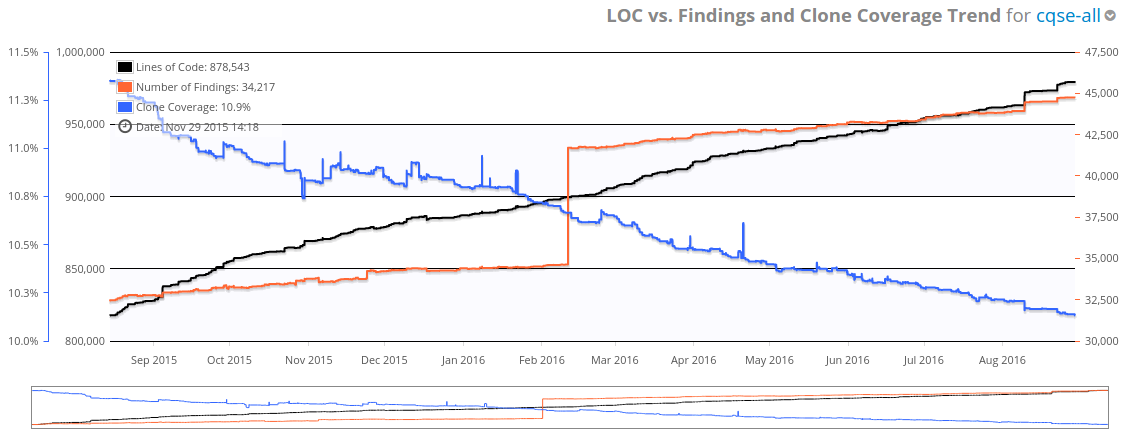
Dashboards can also display trends as graphical trend charts (see below). The template already provides trend chart for the lines of code metric and the number of findings. With the same edit mechanism as above, the widget can be configured to show any numeric metric trend. The default time span of the interval is set to zero days, which means that the entire available history is included. To obtain the graph as depicted below, we configured the widget to include the clone coverage metric.
Finding the Root Cause for a Trend
Sometimes, metric trends reveal suspicious drops or increases, for example the sharp increase in the number of findings (red line):
This makes us as quality engineers curious to find out what happened. With a specific configuration of the dashboard, you can discover the underlying root cause. Let us show you how: As before, go to the edit mode of our dashboard and open the dialog Edit Parameters of this specific metric trend chart widget. Enable the two options Zooming and Action Menu . Then save the dashboard.
To inspect a suspicious change in a trend, use the mouse to mark the area which you would like to inspect closer and zoom in, as indicated here:
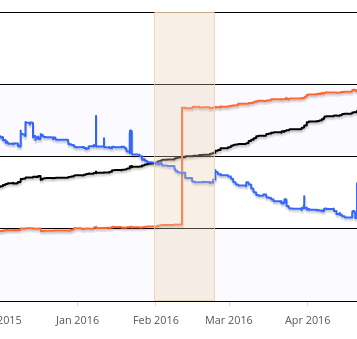
Zooming in narrows down the time interval while providing a higher resolution. When releasing the mouse button, the chart will update to represent the zoomed-in area. Then, use the action menu button () to select View selected range in delta perspective:
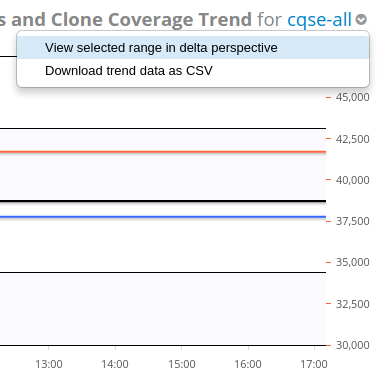
While you are redirected to the Delta perspective, Teamscale computes the so-called delta analysis in the background: It uses the start and the end of the interval that you selected by zooming into the trend chart. It then computes and reconstructs everything that happened in between this start and end date: As a result, it shows you, for example, which files were touched within the time interval or how metrics have changed. In particular, Teamscale also shows you the commits to the repository that were made within this time frame. They are often the first starting point to the root-cause analysis.
Select the Repository Changes in the left sidebar menu and scroll through the commits:
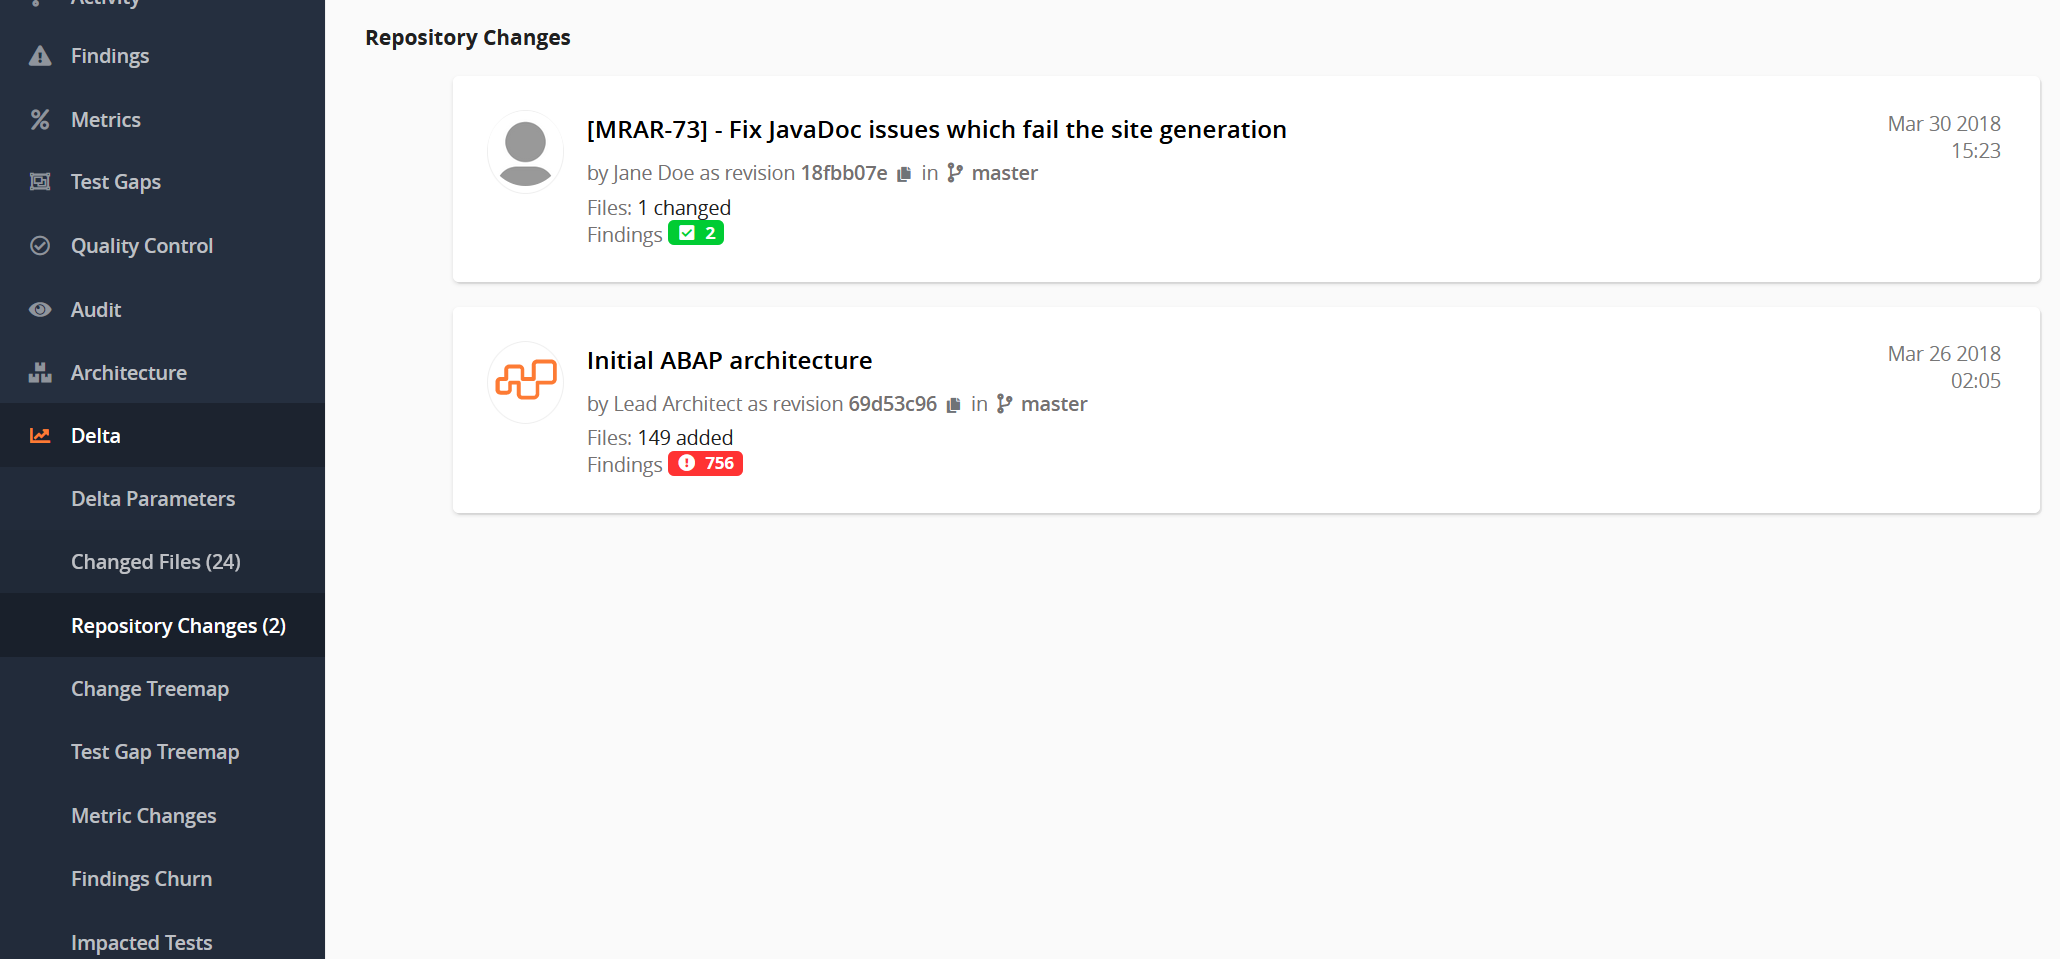
In our specific example, we want to figure out why the findings trend suddenly increased. Hence, we are looking for commits with a high findings churn. As our selected delta only contains two commits, it is rather obvious which one is responsible.
Click on the commit »initial ABAP architecture« to find out more details about the commit:
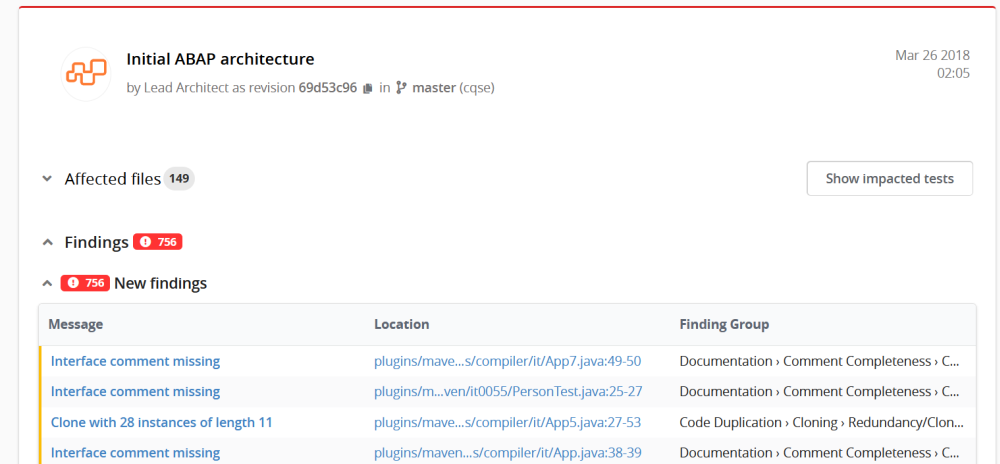
The commit details view shows that a large architectural change has been made. As a result from this large change, more than 750 findings were introduced to the code base. This is the root-cause for the increase in the findings trend.
Analyzing the Findings Churn
Besides monitoring the quality status in terms of metric trends, a thorough quality assessment also comprises a deeper inspection of the evolution of the findings in a system. You might want to check if severe findings were added. You might be curious how many findings were removed. Or if developers became lazy rather than still cleaning up on the fly. To analyze the findings churn, you can use two distinct perspectives: the Findings Perspective or the Delta Perspective . This section focuses on the first. To learn about the Delta Perspective , refer to this guide.
The Findings Perspective in general provides a navigation page through all findings that exist in your system. But it can be also used to just inspect the findings that were added in a specific time frame, for example within the last month. This gives you the chance to assess the recent quality evolution.
To focus on recent findings, use the right sidebar to configure which findings are shown:
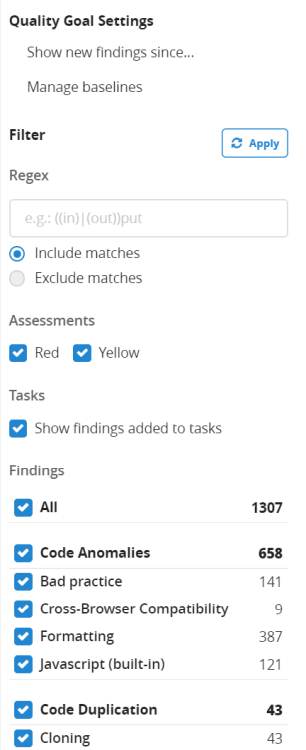
For our use case, click on Show new findings since.... With the dialog opening up, you can select a date - findings will then be shown only if they were added after this reference date. This dialog has different options:
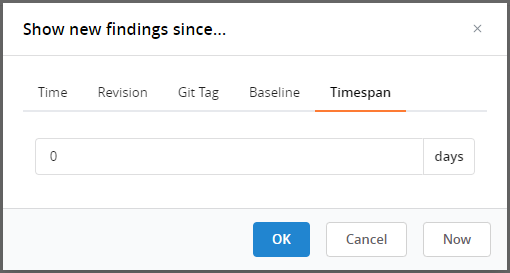
Under Timespan , you can indicate, for example, that new findings from within the last 40 days should be shown. Under Time , you can pick your reference date from the calendar or select it as a revision in your repository under Revision . The Baseline option additionally provides you the opportunity to use a pre-configured baseline (or create a new one).
After you clicked on the button OK, the findings perspective will show you only findings that were added since the selected date. You can see this from the note in the Quality Goal Settings in the right sidebar:
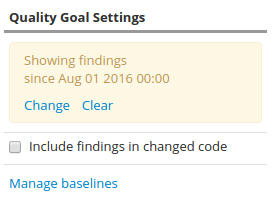
Caring only about the new findings corresponds to the quality goal "preserving" as outlined here. If you would like to assess your quality evolution based on the quality goal improving, enable the option Include findings in changed code . In this case, the findings perspective shows not only the new findings but also findings in code that has been modified since your reference start date.
To filter findings further, you can also filter them based on their finding group and finding category:

For example, deselect the check box All , select only the checkbox Code Duplication and scroll to the bottom of the page to press the button to Apply . The main table of the findings perspective now shows you only recent clones:
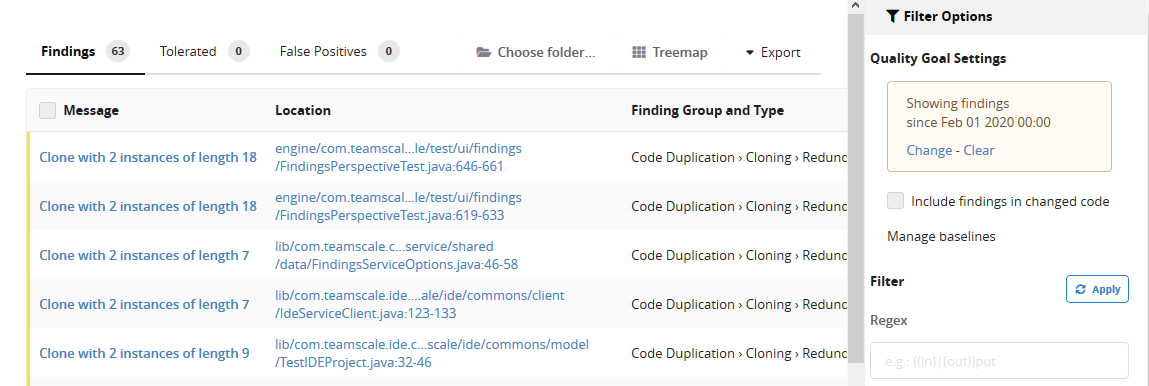
You can use the table header to sort the set of clones, for example based on their number of instances or based on their length. This way, you can inspect, for example the largest clone recently added or the clone with the most instances. This usually should help you assessing what kind of clones were added to the system and how critical they are.
By clicking on a finding, you navigate to the Findings Detail Page of a specific clone. This page gives you more detailed information about the finding. You can inspect the introduction diff , for example, or jump into the code to see the full surrounding file. In the specific example of code clones, you can also view the siblings, i. e. the other instances of the clone.
