Report Slide Overview
The following slide types are available in the report editor:
Title Slide
Contains title and basic information about the report. The Subtitle field can be used with placeholders to automatically render a report's baseline dates and project name. Valid placeholders are:
- {start_date}: date of "Report Start"
- {end_date}: date of "Report End"
- {start_name}: name of the baseline set as "Report Start"
- {end_name}: name of the baseline set as "Report End"
- {project_name}: name of the default project of the report

Section Title Slide
Contains a headline. Useful for improving the report's structure.

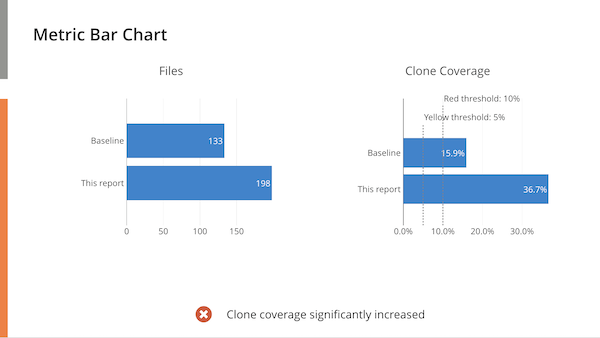
Metric Bar Chart Slide
Contains bar charts comparing the current metric values in your project with the values at report baseline. It can also show target metric thresholds.
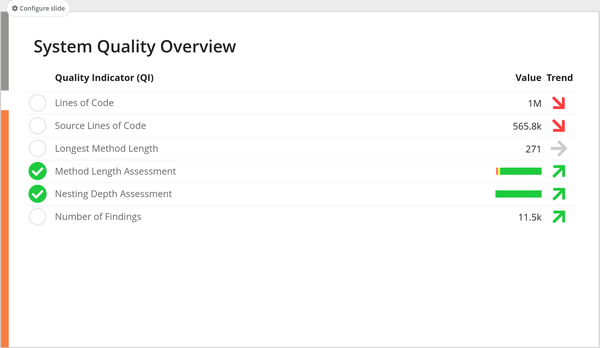
System Quality Overview Slide
Contains a table with metric values in your project (metrics from configured threshold profile). It is similar to the Metric Table Widget in the Dashboard Perspective, but fitted on a slide and additionally allowing to display trend delta values (since report baseline).
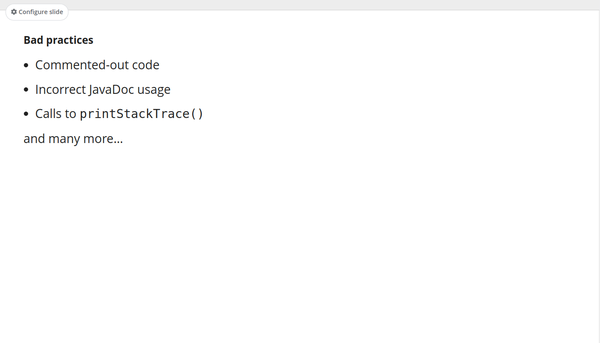
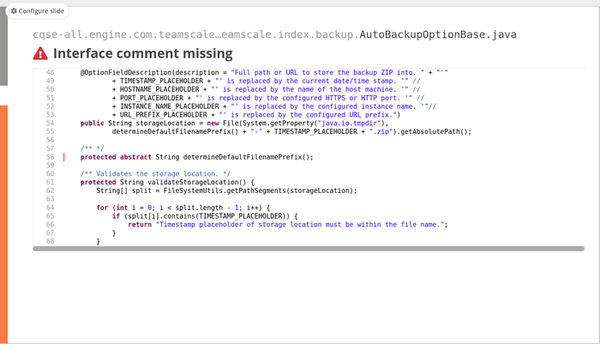
Finding Detail Slide
Contains code snippets of findings in your project:
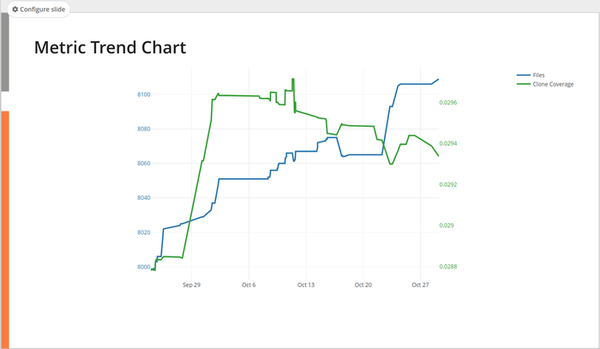
Metric Trend Chart Slide
Contains a chart with metric(s) trend since reports baseline.
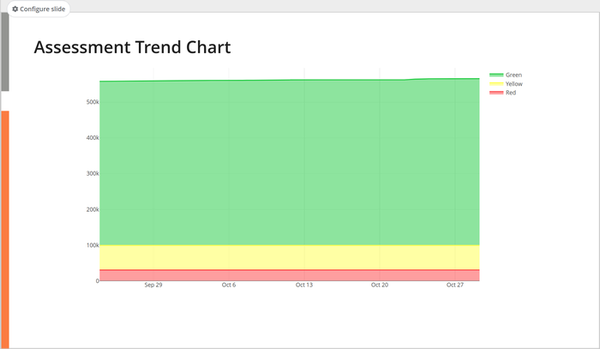
Assessment Trend Chart Slide
Similar to the Metric Trend Chart Slide, but allows to display assessment charts rather than individual metric charts.
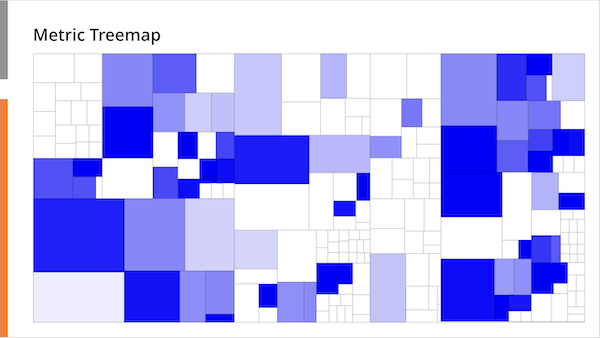
Metric Treemap Slide
Shows a Metric Treemap for the project. You can select different color and area metrics, and customize the included and excluded files. It is similar to the Treemap Widget in the Dashboard Perspective.
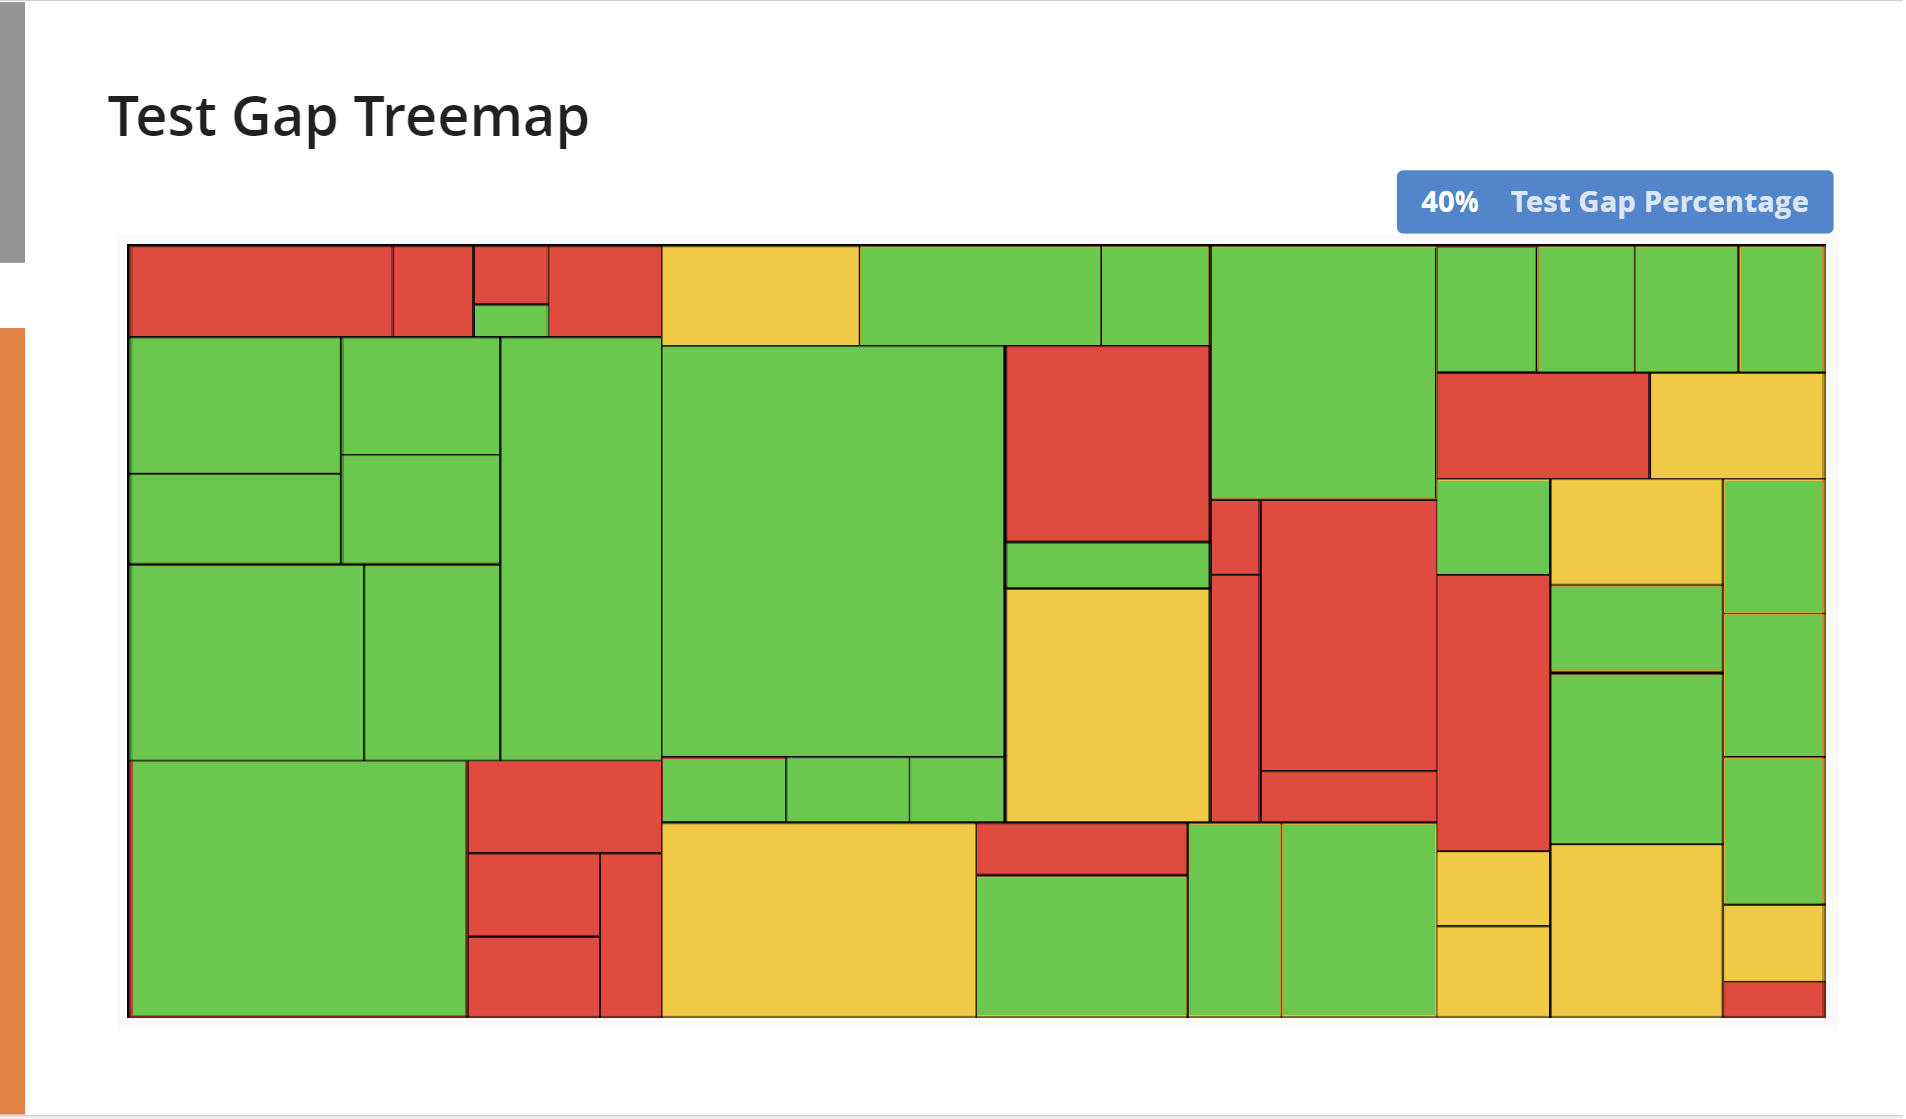
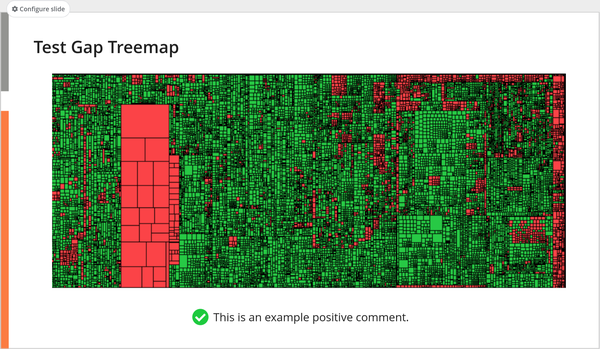
Test Gap Treemap Slide
Contains the Test Gap Treemap of the project. It allows the selection of different display modes e.g. test gaps for all or changed methods.
Task Detail Slide
Contains a detailed view of a task from the Tasks Perspective with its respective code snippets.

Quality Tasks Slide
Contains tasks from the Tasks Perspective fitted on a slide. It allows filtering for tasks that have been, e.g., open or closed since baseline as well as filtering by task tag.
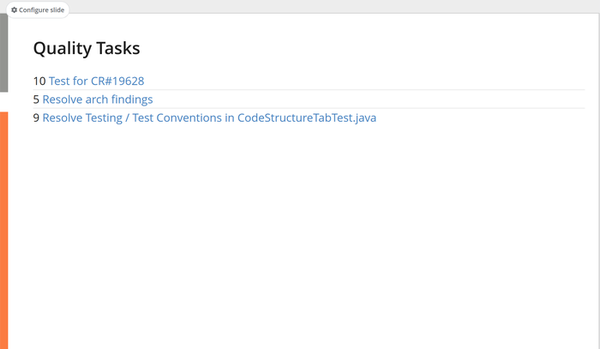
Image Slide
A flexible slide that allows uploading any image to the report and commenting on it. This slide can be used when a specific use case is not covered by the available slide types.
Markdown Slide
A Text slide with markdown support.