Getting an Overview of the Quality of your System
As a developer or project manager, you often want to get an overview of the current quality status of your system – or maybe even of your portfolio of systems. Luckily, Teamscale makes managing both use cases really easy.
Creating a Single Project Overview Dashboard
To get an overview of the quality status of one single project, there are two different ways – either with the Metrics perspective or the Dashboard perspective. We will start with the latter.
To configure your personal overview dashboard, click on the small arrow of the Add Dashboard button (right sidebar) and choose Create from template (T) from the drop-down menu. The following dialog will let you configure the properties of the new dashboard, e.g., give it a name and select a template, e.g., the default overview template. For more details, please refer to this article.
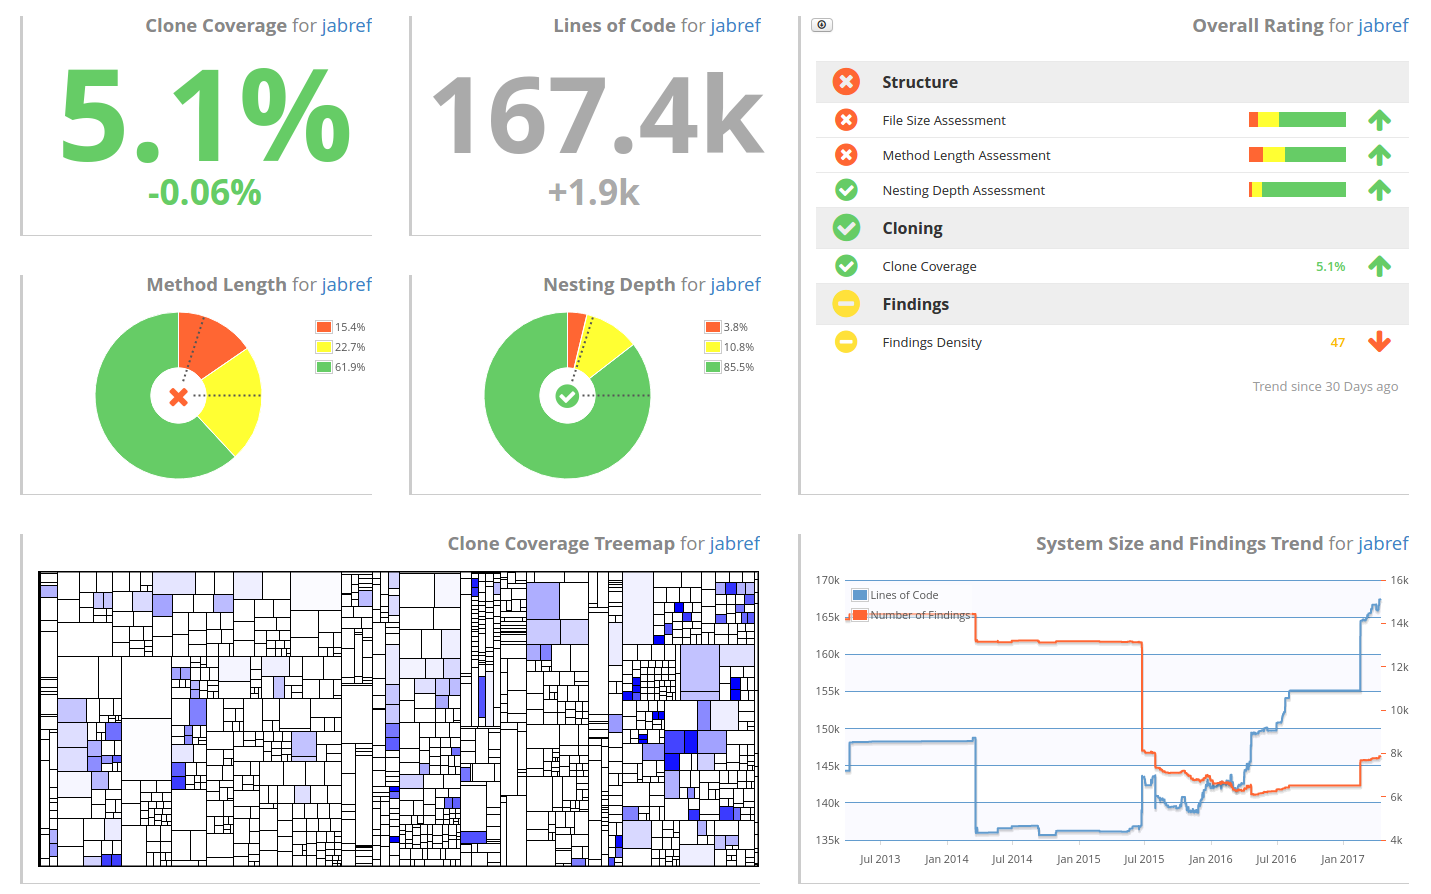
The dashboard now gives you an overview of the quality status of your system:

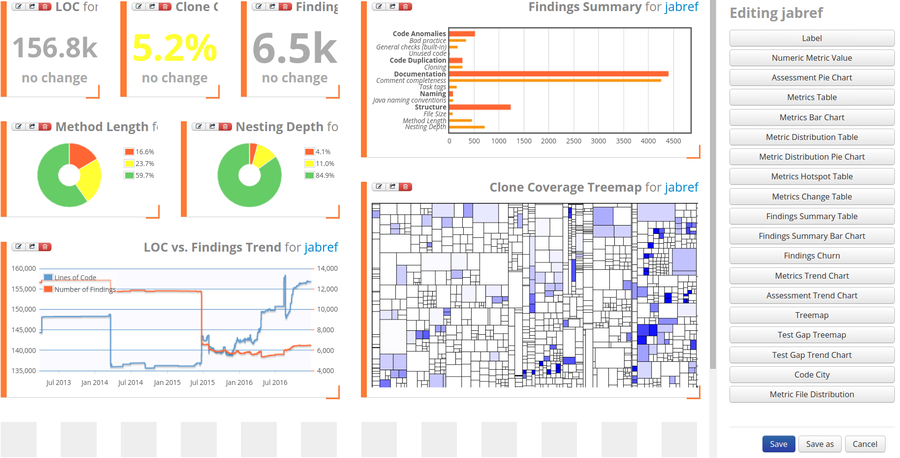
You can modify the dashboard by clicking on next to its name in the right side bar and selecting Edit dashboard . Editing allows you to rearrange the widgets and create or delete widgets. For more details, please refer to this article.

The information from the dashboard can be adapted based on (sub-) project and time. To change the project, edit the dashboard as above and configure each widget using the symbol in the top left corner of a widget. By setting the Path you can either switch to a different project or select a component or subcomponent of your system.
If you would like to change the time for the dashboard, leave the edit mode and go back to viewing the dashboard. Then click on Latest Data in the top right corner:

The timetravel allows you to select a calendar time, a revision or a baseline. Then, the dashboard will display the system's quality status at the selected point in time.
Creating a Multi-Project Overview Dashboard
If your role is being a project manager rather than a developer, you might be more interested in getting an overview of a portfolio of systems. Teamscale's dashboards support combining information from multiple projects:

The image shows a very simple example dashboard displaying the lines of code information for six different projects as well as their trend over the last 30 days. You can combine information from all projects. They do not need to be written in the same programming language and they also do not need to be in the same version control system. As long as you access rights, you can combine any of them in one single dashboard.
Overview in Metrics Perspective
As an alternative to the Dashboard perspective, you can also navigate to the Metrics perspective. Here, you will find an overview of all metrics in the first row of the table of the perspective:

The overview contains all numeric metrics and assessment metrics and can also be configured. However, it does not provide all information available in the Dashboard perspective. Hence, it is useful for a first glance but not for a personally tailored overview.
