Setting up Test Gap Analysis on a Java Application (Pixelitor)
As a developer or tester of a Java desktop application, you may use Teamscale Test Gap Analysis (TGA) to improve your testing effectiveness. This tutorial leads you through the setup of TGA on Pixelitor, an open source graphics editor.
Step 1: Setting up a Teamscale Project
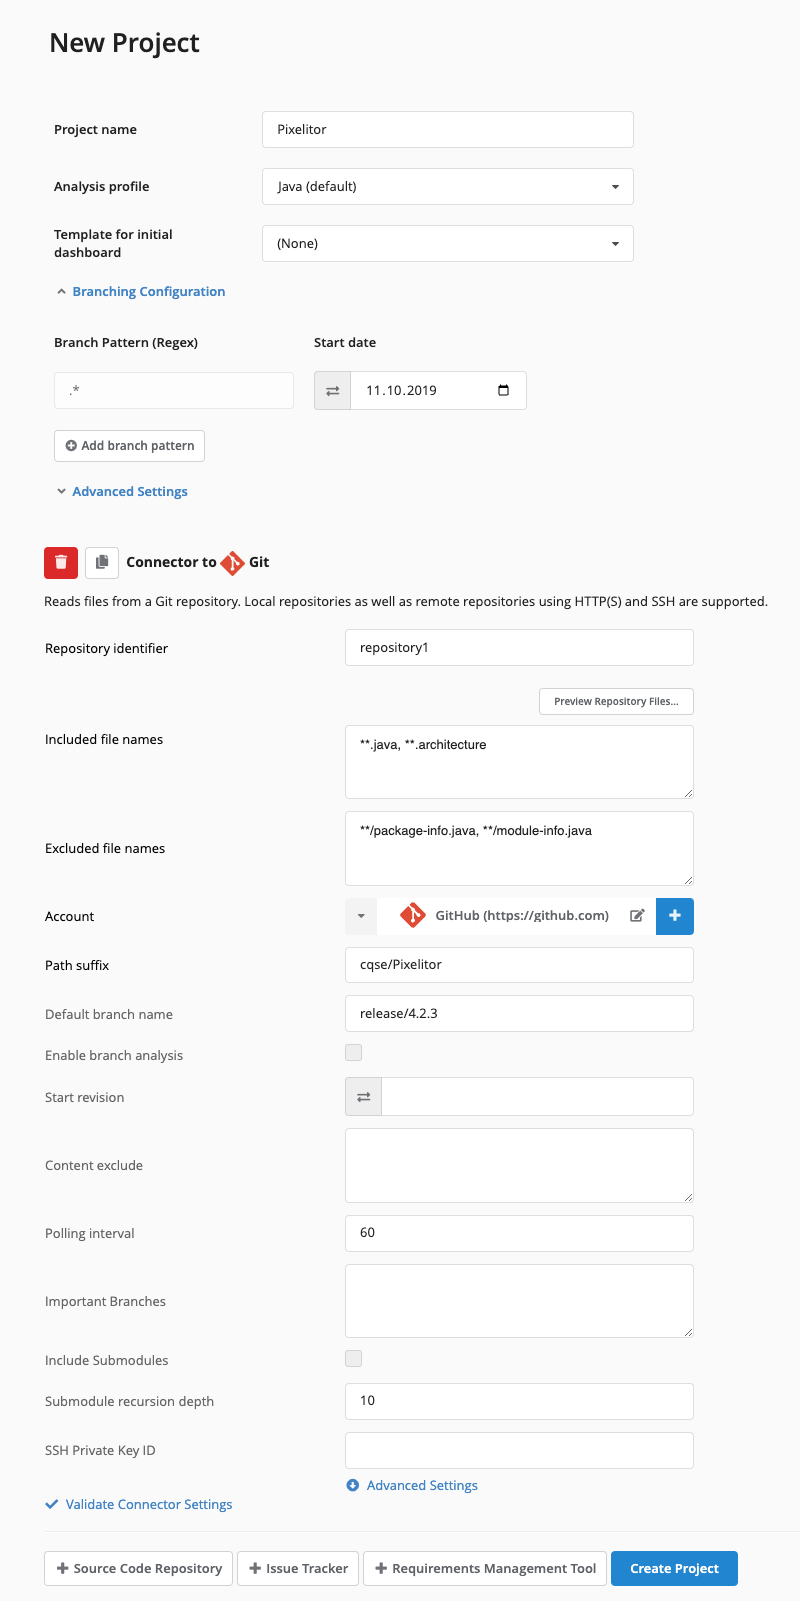
In Teamscale, go to Project Configuration and click New project.
Name the new project Pixelitor and choose the analysis profile Java (default).
In the Branching Configuration, change all start dates to 2019-10-11.
Click Source Code Repository and select Git. Create a new account named GitHub with the URI https://github.com and without credentials. Set the Path suffix to cqse/Pixelitor and the Default branch name to release/4.2.3.
We set the analysis start and the branch in a way that we can see the test gaps between version 4.2.2 (released on October 11, 2019) and version 4.2.3.
Click Create project.
Step 2: Downloading Pixelitor
As a prerequisite for running Pixelitor, install Java 8 or 11, for example from OpenJDK.
Next, download Pixelitor from the link below and extract it to an empty directory on your system.
Finally, start Pixelitor by executing java -jar Pixelitor-4.2.3.jar in the installation directory to verify that the application starts up.
Custom Pixelitor Build
We're using a custom build of Pixelitor that includes a git.properties file. The Teamscale Java Profiler uses this file to determine which version of Pixelitor we are testing. The documentation of the Teamscale Java Profiler explains how to configure this, however, for this tutorial, you can just use the downloaded Jar file as-is.
Step 3: Installing the Teamscale Java Profiler
Download the latest release of the Teamscale Java Profiler and extract it into the same directory as Pixelitor. Within the teamscale-jacoco-agent directory create a teamscale.properties file with the following content:
url=http://localhost:8080
username=your-user
accesskey=your-access-key
Go back to Teamscale to retrieve the access key. Navigate to the Admin > Users view, select your user and then click on Generate New Access Key.
Permissions in Production Setup
In a production setup, create a dedicated build user with limited permissions.
To configure the profiler, open Project Configuration > Coverage Profilers. In the New profiler configuration dropdown select Create for a JVM (Java, Kotlin, ...) project. Next, select the Pixelitor project in the dialog and enter pixelitor in the Configuration ID field and Manual Tests in the Partition field.
We do this to cluster coverage from manual tests under a descriptive name, separated from the coverage of other testing stages, such as unit tests.
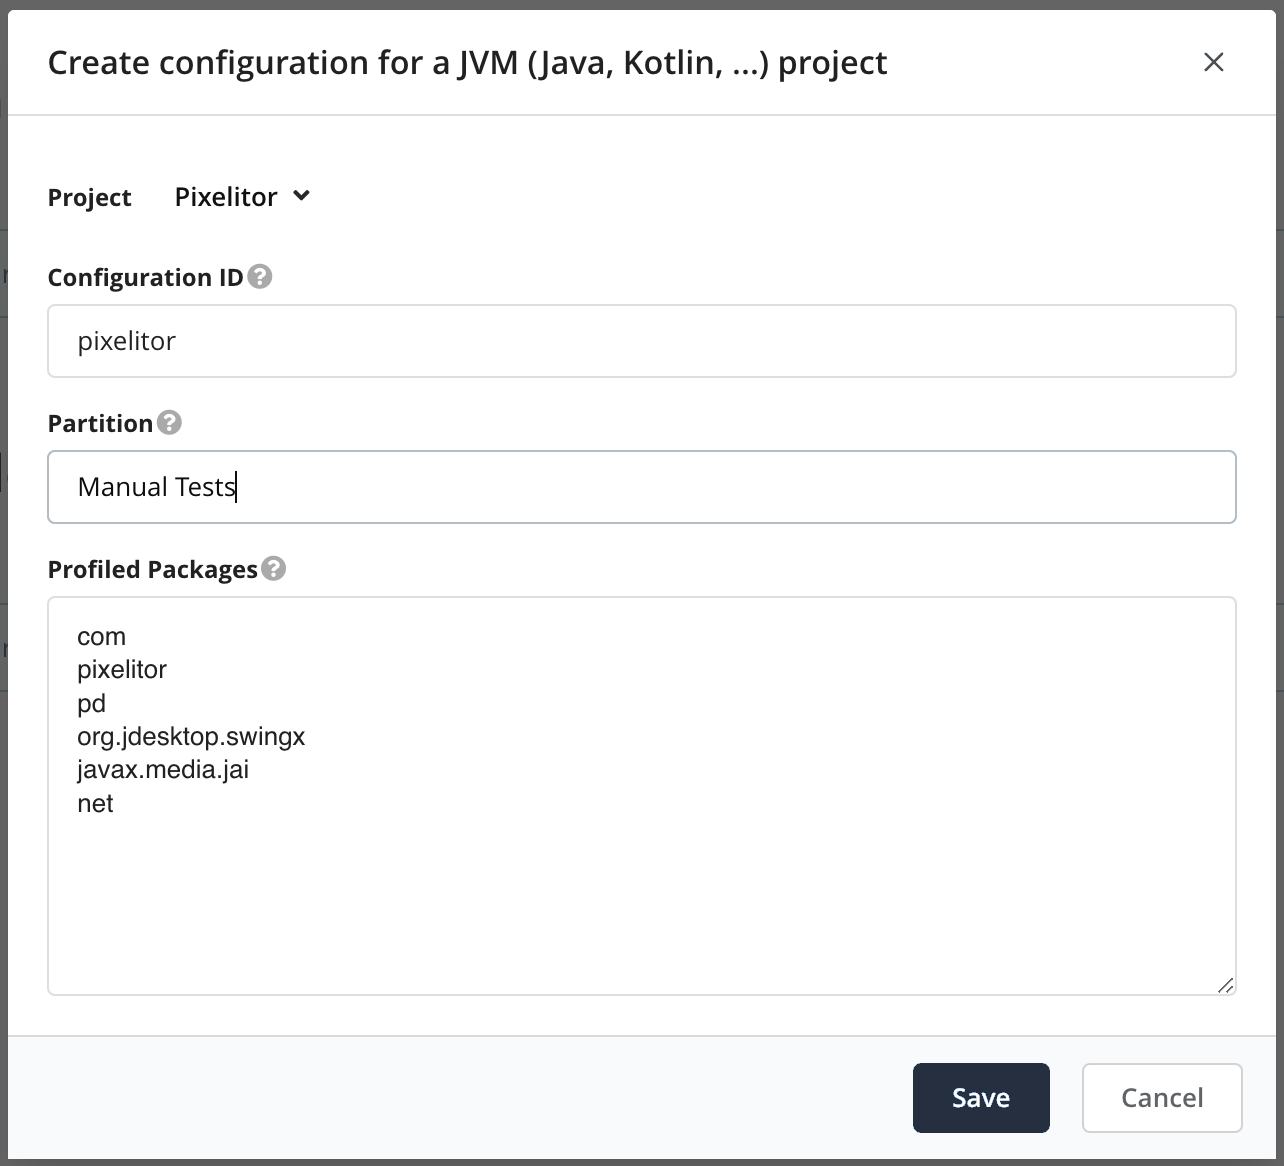
Click on Save.
Now, execute
java -javaagent:teamscale-jacoco-agent/lib/teamscale-jacoco-agent.jar=config-id=pixelitor -jar Pixelitor-4.2.3.jarHere,
java [...] -jar Pixelitor-4.2.3.jarwill start the application,-javaagent:teamscale-jacoco-agent/lib/teamscale-jacoco-agent.jar=...registers the profiler,- and
config-id=pixelitorspecifies the ID of the profiler configuration that should be used to configure the profiler.
Once Pixelitor has started, do some things to generate coverage, e.g., create a new image and let loose the artist within you. Once you clicked around a little, close Pixelitor. On shutdown, the Java Profiler will upload the coverage directly to Teamscale.
Upload Interval for Long Running Applications
Coverage is not only uploaded on shutdown, but also regularly every 8 hours. This is especially useful for long-running applications, such as web apps, where the JVM is not shut down after testing.
The interval can be adapted by adding the option interval=... with the desired number of minutes in the profiler configuration. Setting the interval to 0 disables the periodic upload.
To verify that the upload worked, in Teamscale, go to Activity. Once the data arrived and was processed successfully, the entry on top of the timeline represents the coverage upload.
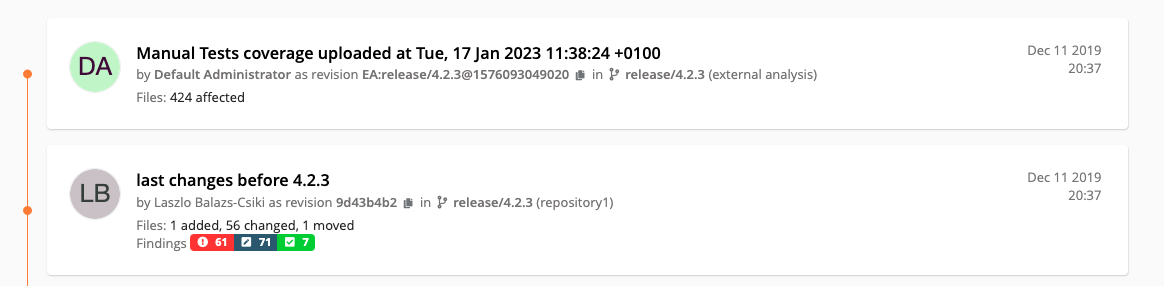
The coverage is appearing on December 11, 2019, due to the git.properties file embedded in the jar. The Teamscale Java Profiler parses the commit ID from this file and uploads the collected coverage to the corresponding time. We do this to ensure that the coverage is associated with the source code corresponding to the version under test.
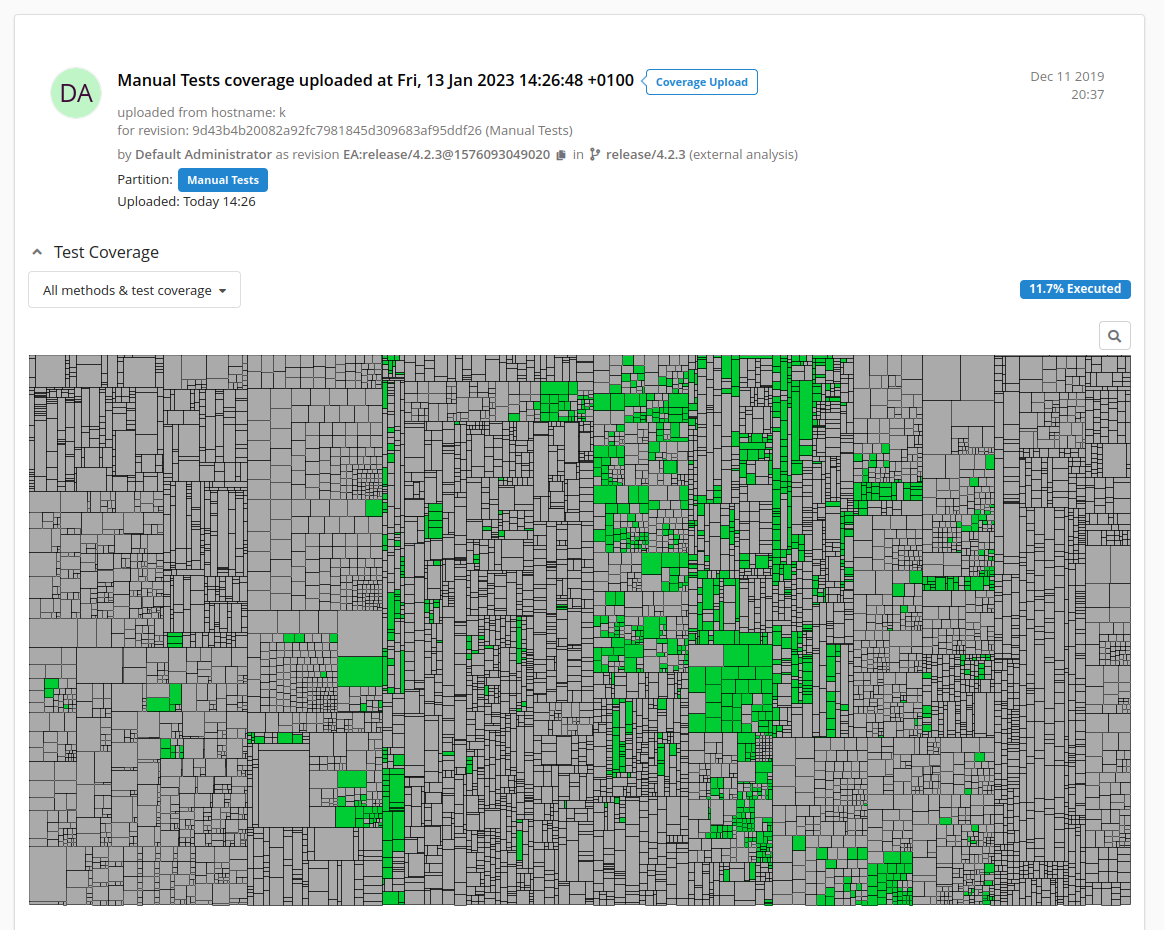
You can click on the topmost entry in the Activity perspective to view the coverage you have generated with your manual test:
Assumption: Reachability of Teamscale
This guide assumes that the Teamscale server is directly reachable from the test environment via HTTP(S). Alternatively, the profiler can also upload the file to an Azure file storage or Artifactory. If Teamscale is not reachable, the coverage file will be saved to teamscale-jacoco-agent/coverage. For more information, refer to the documentation of our Teamscale Java Profiler.