Setting up Test Gap Analysis on a .NET Core Application (Blogifier)
As a developer or tester of a .NET application, you may use Teamscale's Test Gap Analysis (TGA) to improve your testing effectiveness. This tutorial leads you through the setup of TGA on Blogifier, an open source web application that can be used to self-host a blog.
Step 1: Installing Blogifier
As a prerequisite for running Blogifier, install .NET Core Runtime 6.0 (or newer).
Next, download and unzip the 3.0 release of Blogifier. Note that the release zip contains not only the executable, but also the corresponding PDB (symbol) files.
Finally, start Blogifier.exe and open it in your browser, to ensure that the installation was successful.
Step 2: Installing the Teamscale .NET Profiler
Download the latest release of the Teamscale .NET Profiler and unpack it to C:\teamscale_dotnet_profiler.
To register the profiler, multiple environment variables have to be set. This can be accomplished either by creating a launch script, or by assigning the environment variables system-wide in the Control Panel. For example you can create the Blogifier.bat batch file next to the Blogifier.exe that sets the necessary environment variables and starts the executable:
set CORECLR_ENABLE_PROFILING=1
set CORECLR_PROFILER={DD0A1BB6-11CE-11DD-8EE8-3F9E55D89593}
set CORECLR_PROFILER_PATH_32=C:\teamscale_dotnet_profiler\Profiler32.dll
set CORECLR_PROFILER_PATH_64=C:\teamscale_dotnet_profiler\Profiler64.dll
Blogifier.exe
Workaround for .NET Core profiling in version <= v23.6.0
Due to a bug in the older versions of the Teamscale .NET Profiler, it requires the setting of one more environment variable: set COR_PROFILER_PATH=C:\teamscale_dotnet_profiler\Profiler64.dll
If you want to set the environment variables system-wide, you can do that by navigating to Control Panel > System > Advanced system settings > Environment Variables and adding all the CORECLR_ variables.
Setting the CORECLR_ENABLE_PROFILING variable enables profiling on .NET Core processes. The CORECLR_PROFILER variable provides the GUID of the Teamscale .NET Profiler, which the .NET Runtime uses to verify the profiler DLL on load. Finally, the CORECLR_PROFILER_PATH_32 and CORECLR_PROFILER_PATH_64 tell the .NET Runtime where to find the profiler binaries.
Environment variables depend on the .NET version of the application
Note that Blogifier is a .NET Core application. If you had a .NET Framework application, the prefix of the environment variables must be COR_ instead of CORECLR_.
Next, we configure the profiler itself. Rename C:\teamscale_dotnet_profiler\Profiler.example.yml to C:\teamscale_dotnet_profiler\Profiler.yml, then edit the file.
Adjust the global configuration section, i.e., the first entry below match, as follows:
{
  # ...
  match: [
    {
    # This section matches all processes.
    # We configure shared options here but disable the profiler.
    # The later match sections will enable the profiler for specific processes.
      profiler: {
        enabled: false,
        targetdir: "C:\\blogifier_coverage",
        upload_daemon: false
      },
    # ...
    }
  ]
}
This globally disables both the profiler, to avoid profiling unnecessary processes, and the automatic upload of coverage, which we will configure later. Moreover, it instructs the profiler to write trace files to C:\blogifier_coverage.
Permissions
Ensure that C:\blogifier_coverage exists and that the user running Blogifier.exe can write to it. Otherwise, profiling the process will fail.
Next, add a process-specific configuration section below the global one (delete all other sections from the template), to enable the profiler specifically for the Blogifier executable:
{
  # ...
  match: [
    {
    # This section matches all processes.
    # ...
    },
    # These sections turn on the profiler for specific executables.
    {
      executableName: "Blogifier.exe",
      profiler: {
        enabled: true
      }
    }
  ]
}
To test your setup, start Blogifier with the batch file you have created in Step 2. This will open a console window that shows the logs of the web application, and will start the application on the default 5000 port. Open the application in the browser, do something (e.g., create an admin user), and then stop Blogifier by pressing Ctrl+C in the console window. The target directory C:\blogifier_coverage should now contain a coverage report named like coverage_20230629_1352510131.txt (the date and time parts of the file name will differ) with some content.
Reduce Performance Impact
Profiling processes always incurs a performance impact on the processes. The Teamscale .NET Profiler minimizes this impact, but cannot completely avoid it. To minimize the overall impact, ensure you always configure the minimal set of processes (executables).
Troubleshooting For Missing Coverages
If you cannot find the coverage files in the target directory, the root cause is typically one of these reasons:
- The profiler was not attached to your application. For this, you can check the log file at
C:\teamscale_dotnet_profiler\attach.log. The profiler creates this file and always adds a new entry when it is attached. If there is no new entry, check if the profiler is enabled for your executable in theProfiler.ymlfile. - The
Profiler.ymlconfiguration was not found by the profiler. In this case the profiler creates the coverage files atC:\Users\Publicby default. To solve the issue, ensure that theProfiler.ymlfile is in the same folder as the profiler DLLs. You can also provide a custom path to your configuration file via the environment variableCOR_PROFILER_CONFIG. - The
Profiler.ymlconfiguration file is syntactically incorrect. In this case in newer versions of the profiler the error is shown and logged to the standard error stream, and the execution of the application is aborted. In older versions, the profiler creates the coverage files atC:\Users\Public, and you can find the corresponding error message on the top of the coverage files. - The target directory does not exist or is not writeable by the user who runs the executable. To solve this, check which user runs the process to be profiled and check the write permissions of the directory.
Step 3: Uploading Coverage to Teamscale
The Teamscale .NET Profiler comes with the ability to upload coverage directly to a Teamscale instance. During the upload, the profiler maps the recorded coverage to the source code of the application under test, using the respective PDB files.
Assumption: Reachability of Teamscale
This guide assumes that the Teamscale server is directly reachable from the test environment via HTTP(S). Alternatively, the profiler can upload reports to a file share, where they may be picked up and forwarded from another machine.
Step 3.1: Preparing Teamscale
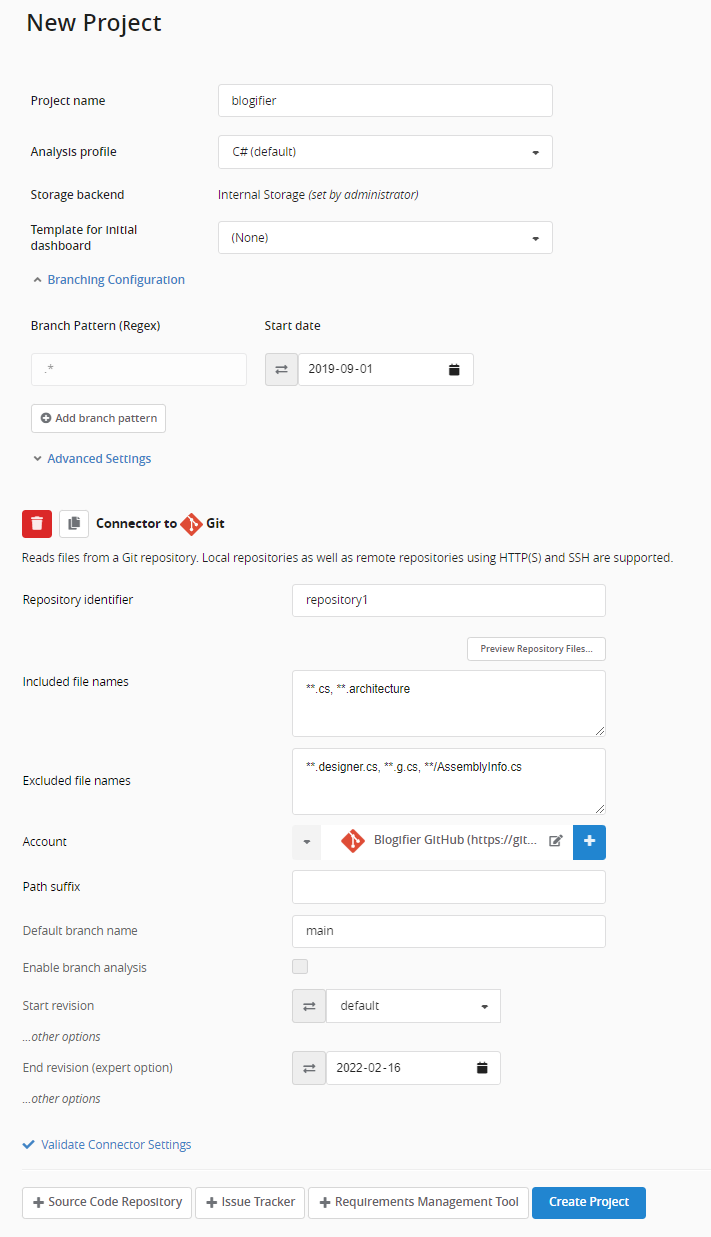
In Teamscale, go to Project Configuration and click New project.
Name the new project blogifier and choose the analysis profile C# Default.
In the Branching Configuration, change all start dates to 2019-09-01.
Click Source Code Repository and select Git. Create a new account named Blogifier GitHub with the URI https://github.com/blogifierdotnet/Blogifier.git and without credentials. Set the Default branch name to main.
Click on Advanced Settings and set the End revision (expert option) to 2022-02-16. This day is after the v3.0 release, so this way Teamscale will analyze all changes between v2.5 and v3.0.
Start revision and Branching Configuration interact
If you create a project with more than one source code connector (e.g. to integrate multiple Git repositories into one Teamscale project), you can control how much history is analyzed by Teamscale:
- centrally via the Branching Configuration,
- separately for each connector via the Start Revision.
If you set both, the more recent of the two dates is applied to the connector.
Default end revision
In this example we have set the End revision to shorten the analyzed history. If you want to analyze your code continuously, you have to leave End revision set to the default value. This way Teamscale will always analyze up to the latest revision of the repository.
Click Create project.
Step 3.2: Linking the Version Under Test to a Source Code Revision
Create the file C:\revision.txt and set the file's content to revision: 8e634ab4b93a60df0e216f3929b35c17cbffb1ca. This revision identifies the source code corresponding to the Blogifier 3.0 release, which we want to link the coverage information to.
Keep the Version Under Test and revision.txt in Sync
If you change the version under test, you also need to adjust the revision.txt accordingly. We recommend to automate this in real test environments.
Always Using Latest Revision
If you would like to upload the coverages to the last commit in your repository, you can provide revision: HEAD as a value in the revision.txt file.
Step 3.3: Uploading Coverage
Edit C:\teamscale_dotnet_profiler\Profiler.yml again and change the global configuration section to match the following:
{
  # ...
  match: [
    {
    # This section matches all processes.
    # We configure shared options here but disable the profiler.
    # The later match sections will enable the profiler for specific processes.
      profiler: {
        enabled: false,
        targetdir: "C:\\blogifier_coverage",
        upload_daemon: true
      },
      uploader: {
        teamscale: {
          url: "http://localhost:8080", # use your URL
          username: "admin", # use your username
          accessKey: "u7a9abc32r45r2uiig3vvv", # use your access key
          project: "blogifier",
          partition: "Manual Tests"
        },
        pdbDirectory: "C:\\path\\to\\Blogifier", # use the folder where Blogifier.pdb is located
        revisionFile: "C:\\revision.txt",
        assemblyPatterns: {
          include: [
            "Blogifier.*"
          ]
        }
      }
    },
    # These sections turn on the profiler for specific executables.
    {
      executableName: "Blogifier.exe",
      profiler: {
        enabled: true
      }
    }
  ]
}
This globally enables and configures automatic uploading of coverage data.
Use the URL and credentials (username and access key) of your Teamscale instance. The project option contains the ID of your Teamscale project such that the coverage data is sent to this project. The partition is an arbitrary label that you may use to distinguish coverage source, such as different test stages. Teamscale merges all coverage in the same partition and allows you to inspect coverage in different partitions individually (or in any combination).
During the upload, the Teamscale .NET Profiler maps the coverage data back to a particular version of the source code, using the PDB files and the revision ID from the revision.txt. It will do so for all the assemblies of Blogifier (whose names match the regular expression Blogifier.*).
To test your setup, start Blogifier.bat, do something (e.g., create a new blog entry), and stop it again. The profiler automatically schedules uploading of coverage data from terminated processes every five minutes.
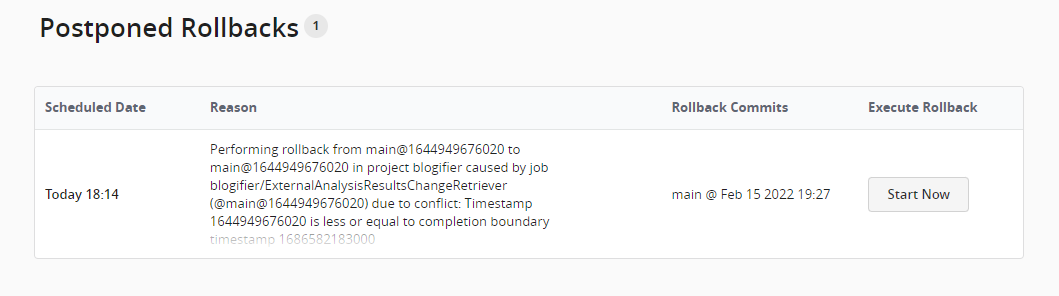
Project state is "On hold"
If the uploaded data targets an old commit of the project, Teamscale does not schedule analyzing the data automatically, to prevent large rollbacks. To proceed, navigate to the Project Configuration > Projects view. When the data is uploaded, the state of the project changes to "On hold". Click on the "On hold" label, then on the "Start Now" button.

To verify that everything worked as expected, go to the Activity perspective. If you filter your commits for the Commit Type "External Analysis", and the data was processed successfully, you will see the coverage upload.

Environment variables
Note that if you did not set the environment variables system-wide, but inside a launch script, ensure that you are starting Blogifier using the launch script (i.e. Blogifier.bat) instead of running Blogifier.exe directly. Otherwise this will result in a wrong configuration of the environment variables.
Permissions
Ensure that the user running the executable has read access to the folder containing the PDB files. Otherwise, processing the coverage will fail.
Upload Interval
You may configure the upload interval in the Profiler.yml file, using the uploadIntervalInMinutes option.
Reduce Performance Impact
Mapping coverage data to source code takes some processing time that adds to your overall test execution time. To avoid wasting time on unnecessary mapping, ensure you always configure the minimal set of assemblies, i.e., exactly the assemblies containing the code that you want to identify test gaps in.
Missing Uploads
If the Upload Daemon has failed to upload the coverage files, you can find the error logs at C:\teamscale_dotnet_profiler\UploadDaemon\UploadDaemon.log.
Step 4: Analyzing Coverage and Test Gaps
Step 4.1: Test Gaps at File Level
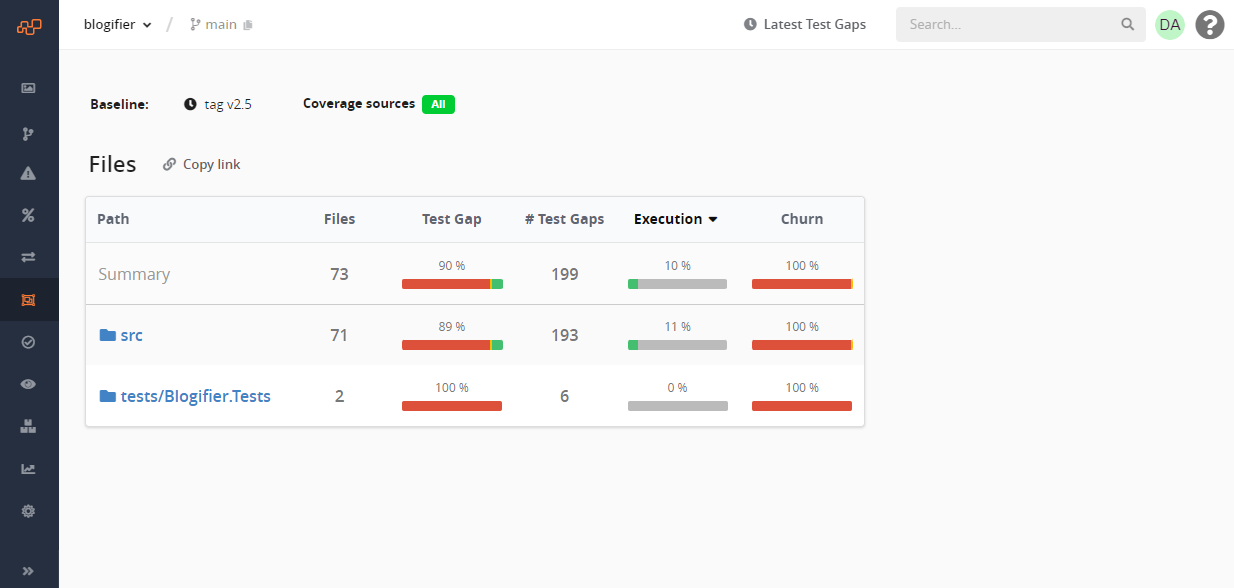
In Teamscale, go to Test Gaps > Files and set the baseline to Git Tag v2.5 at the top.
Test Gaps Between Two Dates
If you need to see the test gaps between two specific dates:
- first you have to select the start date as a baseline at the top of the view,
- then click on "Latest Test Gaps" to activate the time travel mode, and select the end date.
After closing the time travel dialog, the view will display the test gaps between the two selected dates.
The table on the page shows the file-system structure of the Blogifier project, with Test Gaps, Execution, and Churn data aggregated for each file or directory. You may drill down into the folders and click on the colored bar charts to check what exactly has been changed or executed and where the test gaps are.
Hint
The Execution and Test Gap data may look different for you, depending on the actions you performed in Blogifier.
Step 4.2: Test Gaps at Method Level
In Teamscale, go to Dashboards. In the top bar click Add a new dashboard and then choose Test Gap Treemap from the list of widgets. Finally, click Save Dashboard and name the Dashboard Blogifier Test Gaps.
Move the mouse over the Test Gap Treemap and click on the icon that appears in the upper left, to edit the widget. As the Baseline, select the Git tag v2.5. Make sure that Manual Tests is selected under Coverage Sources, for the widget to consider the coverage you uploaded earlier. Confirm the dialog.

The widget now shows the code changes between version 2.5 and 3.0 in color. The red and yellow blocks represent methods that have been changed, but were not covered by tests, i.e., test gaps. Hover the mouse over the blocks in the treemap to see details in a tooltip. Click on the blocks to drill into the data.

Hint
The treemap may look different for you, depending on the actions you performed in Blogifier.