Teamscale JavaScript Profiler
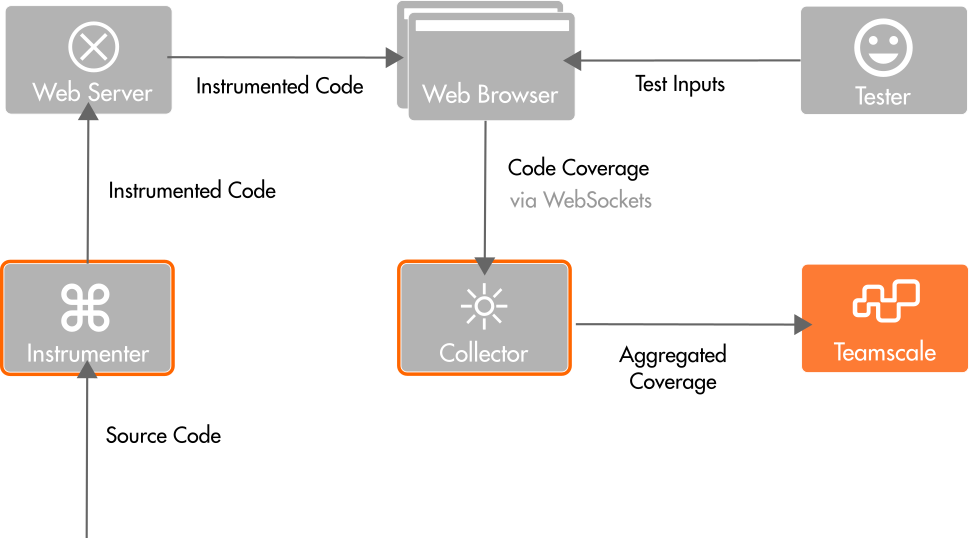
The Teamscale JavaScript Profiler can be used to collect test coverage for JavaScript/TypeScript applications in the browser. It consists of two parts, the instrumenter and the coverage collector. The instrumenter adds statements to the code that signal reaching a particular code line when running it in the browser. The obtained coverage is aggregated in the Web browser and sent to a collecting server (the collector) once a second. Besides the coverage information, also the source maps of the code in the browser are sent to the collector once. The collector uses the source map to map the coverage information back to the original code and builds a coverage report that can be handed over to Teamscale. Teamscale uses the coverage information, for example, for Test Gap analysis.
An overview of the Teamscale JavaScript Profiler components and their interactions is given in the following illustration:
How-To
If you are looking for a quick guide on how to use the Teamscale JavaScript Profiler to collect coverage in the browser, please have a look at our how-to page.
Prerequisites
To use the Teamscale JavaScript Profiler, a number of prerequisites have to be in place.
The instrumented code must be executed in a (possibly headless) browser environment that supports at least ECMAScript 2015. Furthermore, we require that a DOM and WebSockets are available in that execution environment. In other words, the approach supports Edge >= v79, Firefox >= v54, Chrome >= v51, and Safari >= v10. Instrumented applications will fail in Node.js.
To run the components of the profiler, we recommend using the latest Node.js LTS version, at least, version 14 is needed.
Source Maps
The code which is executed in the browser often does not correspond to the code written by the developers. It can be the result of several transformation steps, for example, compilation (transpilation) from other languages, source code minimization, or bundling.
The presence of source map files in the code of the test subject ensures that the tested code can be mapped back to the original. Depending on your build pipeline, a different approach must be chosen to add the source maps to the test subject's code bundle.
In the following we provide pointers to relevant configuration options for some of the popular tools used in the context of JavaScript applications:
// tsconfig.json
{ compilerOptions: { sourceMap: true, inlineSources: true, ... }, ... }
See the Typescript documentation for more details and options.
Content Security Policy
To use the profiler, the application's Cross-Origin Resource Sharing (CORS) has to be adjusted. The instrumented application sends coverage information via WebSockets to a collecting server. That is, communication via WebSockets must be allowed. Whether this is allowed is determined by the Content-Security-Policy attribute. This attribute is either part of the HTTP header sent by the Web server delivering the Web application, or by a corresponding HTML entry. If the collecting server is running on the same machine as the browser, then communicating with localhost must be allowed by adding ws://localhost:* for connect-src, blob, and worker-src to the Content-Security-Policy header.
The following snippet shows the content security policy that has to be added for allowing accessing the collector at host <collectorHost> on port <port>:
connect-src 'self' ws://<collectorHost>:<port>;
script-src 'self' blob: ws://<collectorHost>:<port>;
worker-src 'self' blob: ws://<collectorHost>:<port>;
By not specifying a content security policy, everything would be allowed. This can also be specified explicitly, for testing environments:
default-src * data: blob: filesystem: about: ws: wss: 'unsafe-inline' 'unsafe-eval' 'unsafe-dynamic'; script-src * data: blob: 'unsafe-inline' 'unsafe-eval'; connect-src * data: blob: 'unsafe-inline'; img-src * data: blob: 'unsafe-inline'; frame-src * data: blob: ; style-src * data: blob: 'unsafe-inline'; font-src * data: blob: 'unsafe-inline';The place to configure the content security policy depends on the backend framework that serves the frontend code. See, for example, the Spring documentation on that topic.
Instrumenter
The Instrumenter instruments a given (set of) JavaScript file(s) such that (1) coverage information is produced and then (2) forwarded to the Collector.
Usage
The instrumenter is available as a Node.js package with the name @teamscale/javascript-instrumenter. You can execute the instrumenter via npx, for example, the following command is used to instrument an example app:
npx @teamscale/javascript-instrumenter \
    --input ./dist/ \
    --collector localhost:54678 \
    --config-id rc-testing-js-frontend \
    --commit 55fde99d17fc8c6d0814931718aa95f1048aead5 \
    --in-place \
    --include-origin 'src/app/**/*'
Options
In the following, we have provided a listing of available Instrumenter command line parameters.
Environment Variables
All relevant parameters can also be set via environment variables. For example, instead of the parameter --collector, you can define the environment variable COLLECTOR. Environment variables are written in UPPERCASE_LETTERS_SEPARATED_BY_UNDERSCORES.
Instrumenter Input and Output
| Option | Description |
|---|---|
-i, --input <path …> | The input file(s) or folder(s) to instrument. |
-o, --to <path> | Path (directory or file name) where the instrumented version is written. |
-l, --in-place | If set, the original files are replaced by their instrumented counterparts. |
-e, --exclude-bundle <pattern …> | Glob pattern(s) of input (bundle) files to keep unchanged (i.e. not instrumented). |
-k, --include-origin <pattern …> | Glob pattern(s) of files in the source origin to include in the coverage report. Multiple patterns can be separated by space. |
-x, --exclude-origin <pattern …> | Glob pattern(s) of files in the source origin to exclude from the coverage report. Multiple patterns can be separated by space. |
--source-map <path> | External location of source-map files to be considered during instrumentation. |
Coverage Target Parameters
| Option | Description |
|---|---|
-a, --app-name <name> | Name of the application for which coverage is reported. Improves readability of the autogenerated application ID. |
-c, --collector <url> | Collector address (host:port, wss://host:port/ or ws://host:port/) that receives the coverage data. Default: ws://localhost:54678. |
-t, --collector-config-file <file> | Path to a configuration file that specifies or overrides collector settings. |
--collector-option <key=value …> | Sets a collector configuration option (may be given multiple times). |
--collector-options-list | Lists all collector options that can be configured via --collector-option or a config file. |
-r, --commit <commit> | Commit descriptor (<branch name>:<UNIX timestamp ms> or Git hash) identifying the code revision the coverage belongs to. |
-f, --config-id <id> | Profiler configuration ID to use. The configuration is re-fetched from Teamscale every minute. |
--relative-collector <pattern> | Derives the collector URL from the application host name (handy in Kubernetes). See command-line help for available operations. |
Security Risk
When specifying credentials of other services via --collector-config-file or --collector-option, the credentials will be included in the instrumented source code and are thus visible to anyone that can access your deployed application. We recommend you instead give these credentials to the collector directly when launching it.
Troubleshooting
| Option | Description |
|---|---|
-m, --dump-origin-matches-to <file> | Writes a JSON file containing the names of source files that matched the origin include/exclude patterns. |
-p, --dump-origins-to <file> | Writes a JSON file containing source-origin file names derived from source maps. |
--log-level <level> | Sets the log level (trace, debug, info, warn, error). Default: info. |
Instrumentation Excludes
We provide two types of patters for excluding code from being instrumented: based on the origin of the code and based on the bundles the code was combined into.
Origin-based
-x [EXCLUDE_ORIGIN ...], --exclude-origin [EXCLUDE_ORIGIN ...]Glob pattern(s) of files in the source origin to exclude from instrumentation. These patterns match file names found in the original source code files.
Bundle-based
-e [EXCLUDE_BUNDLE ...], --exclude-bundle [EXCLUDE_BUNDLE ...]Glob pattern(s) of input bundle files to keep unchanged (to not instrument). This pattern matches the name of the final bundle files passed to the instrumenter as inputs.
Relative Collector
As specified via the --relative-collector option. Useful for Kubernetes deployments where the collector URL is not known at instrumentation time.
Example
--relative-collector replace-in-host:app collector,scheme:wssThis causes the first occurrence of app in the application hostname to be replaced with collector and the URL scheme changed to wss.
Available operations:
replace-in-host:SEARCH REPLACEreplaces the literal termSEARCHonce in the hostname withREPLACE.port:NUMBERchanges the port toNUMBER.port:keepkeeps the port of the application (instead of using the chosen scheme's default port).scheme:SCHEMEchanges the URL scheme to one ofws,wss,httporhttps.path:PATHusesPATHas the URL path (instead of no path).
Commit
-r COMMIT, --commit COMMITThe application you are testing was typically from a specific revision of your source code, and you might want to test different revisions of the same application concurrently. To differentiate between coverage collected for different revisions, specify the revision the application was built from via the parameter --commit, for example, --commit main:1741709771000 (branch and Unix epoch timestamp) or --commit bb918e2b666b226553e791187c94c7811cf0da9e (Git commit hash). You can either specify a commit as a pair of branch name and Unix epoch timestamp in milliseconds, separated by colon, or provide a revision string, for example, a Git hash.
Coverage Collection Options
The instrumenter can pass configuration options to the collector. These options determine how the collector behaves, such as the frequency of coverage dumping.
  -f CONFIG_ID, --config-id CONFIG_ID
	The ID of the profiler configuration to use; this configuration is refetched
	from Teamscale once a minute.
Teamscale enables you to specify configuration parameters for coverage profilers directly in its UI, where profiler configurations are defined using a configuration ID. By providing this configuration ID via --config-id to the instrumented application, the Coverage Collector retrieves the configuration to determine its coverage dumping behavior, such as specifying the coverage dump interval. The configuration format and the available options are the same as to those that can be provided via the instrumenter parameter --collector-config-file; see below for a list of available options.
  -t COLLECTOR_CONFIG_FILE, --collector-config-file COLLECTOR_CONFIG_FILE
	Provide a configuration file that specifies or overwrites the configuration of
	the Coverage Collector.
  --collector-option COLLECTOR_OPTION, .., COLLECTOR_OPTION
	Sets a given collector configuration option. Provided as key=value pairs.
  --collector-options-list
	Lists the options that can be set for the collector, via a
	--collector-config-file or via --collector-option.
Configuration options can also be passed to the collector either individually via --collector-option KEY=VALUE or grouped together in a configuration file (file with pairs of KEY=VALUE, each on a separate line) via --collector-config-file CONFIG_FILE. The latter option is recommended since it allows for easier maintenance of multiple configuration options. The list of all available collector options that can be configured from the instrumented application can be listed via the --collector-options-list flag. Here is an example of a configuration file content:
teamscaleProject=powersense
teamscalePartition=GenU25-aarch
dumpAfterMins=90
In the paragraphs that follow, we describe the parameters that are available for configuration (corresponding to the listing provided by the --collector-options-list argument).
The first set of parameters defines the behavior of the Upload to Teamscale:
| Parameter | Type | Description |
|---|---|---|
teamscaleMessage | string | The commit message shown within Teamscale for the coverage upload. Default: JavaScript coverage upload |
teamscalePartition | string | The partition to upload coverage to. |
teamscaleProject | string | The project ID to upload coverage to. |
teamscaleRepository | string | The repository to upload coverage for. Optional: Only needed when uploading via revision to a project that has more than one connector. |
The Coverage Dumping behavior can be adjusted using the following parameters:
| Parameter | Type | Description |
|---|---|---|
dumpAfterMins | int | Dump the coverage information every N minutes. Default: 120 |
dumpToFolder | string | Coverage should be dumped to a folder on the server that the collector is running on. Specifies the name of the subfolder within the collector's dump folder (--dump-folder of the collector) where coverage files should be placed. |
keepCoverageFiles | bool | Whether to keep the coverage files on disk after a successful upload to Teamscale |
An Upload to Artifactory can be configured using the following parameters:
| Parameter | Type | Description |
|---|---|---|
artifactoryAccessToken | string | The access_token for uploading coverage to Artifactory. |
artifactoryPassword | string | The password for uploading coverage to Artifactory. Only needed when not using the --artifactory-access-token option |
artifactoryPathSuffix | string | (optional): The path within the storage location between the default path and the uploaded artifact. |
artifactoryServerUrl | string | Upload the coverage to the given Artifactory server URL. The URL may include a subpath on the artifactory server, e.g. https://artifactory.example.com/my-repo/my/subpath |
artifactoryUser | string | The user for uploading coverage to Artifactory. Only needed when not using the --artifactory-access-token option |
Security Risk
When specifying credentials of other services via --collector-config-file or --collector-option, the credentials will be included in the instrumented source code and are thus visible to anyone that can access your deployed application. We recommend you instead give these credentials to the collector directly when launching it.
Collector
The collector is responsible for collecting the coverage which was recorded for your application in the browser, converting it to a coverage report and (optionally) sending it to Teamscale.
Usage
The collector is available as a Node.js package with the name @teamscale/coverage-collector. It can be installed and started using the npx command.
npx @teamscale/coverage-collectorThis will start the collector, listen to coverage on the default port 54678 and dump it to the ./coverage folder.
Options
In the following, we have provided a listing of available Coverage Collector command line parameters.
Environment Variables
All relevant parameters can also be set via environment variables. For example, instead of the parameter --teamscale-access-token, you can define the environment variable TEAMSCALE_ACCESS_TOKEN. Environment variables are written in UPPERCASE_LETTERS_SEPARATED_BY_UNDERSCORES.
Collector Connectivity
| Option | Description |
|---|---|
-c, --enable-control-port | Enables the remote control API on the specified port (<=0 means "disabled"). Default 0 |
--http-proxy | (optional): The HTTP/HTTPS proxy address that should be used in the format: http://host:port/ or http://username:password@host:port/. |
-p, --port | The port to receive coverage information on. Default 54678 |
Teamscale Server
| Option | Description |
|---|---|
-a, --teamscale-access-token | The API key to use for uploading to Teamscale. |
-s, --teamscale-server-url | Upload the coverage to the given Teamscale server URL. For example, https://teamscale.dev.example.com:8080. |
-u, --teamscale-user | The user for uploading coverage to Teamscale. |
--teamscale-project | The project ID to upload coverage to. |
--teamscale-partition | The partition to upload coverage to. |
--teamscale-revision | The revision (commit hash, version id) to upload coverage for. |
--teamscale-commit | The branch and timestamp to upload coverage for, separated by colon. Used if --teamscale-revision can't be used. |
--teamscale-repository | The repository to upload coverage for. Optional: Only needed when uploading via revision to a project that has more than one connector. |
--teamscale-message | The commit message shown within Teamscale for the coverage upload. |
Coverage Dumping
| Option | Description |
|---|---|
-t, --dump-after-mins | Dump the coverage information to the target file every N minutes and (if configured) send it to Teamscale. Default 360 |
-f, --dump-folder | Target folder for coverage files. Default ./coverage |
-k, --keep-coverage-files | Whether to keep the coverage files on disk after a successful upload to Teamsacle. Default false |
Upload to Artifactory
| Option | Description |
|---|---|
--artifactory-access-token | The access_token for uploading coverage to Artifactory. |
--artifactory-password | The password for uploading coverage to Artifactory. Only needed when not using the --artifactory-access-token option. |
--artifactory-path-suffix | (optional): The path within the storage location between the default path and the uploaded artifact. |
--artifactory-server-url | Upload the coverage to the given Artifactory server URL. The URL may include a subpath on the artifactory server, e.g. https://artifactory.example.com/my-repo/my/subpath. |
--artifactory-user | The user for uploading coverage to Artifactory. Only needed when not using the --artifactory-access-token option. |
Logging Behavior
| Option | Description |
|---|---|
-j, --json-log | Additional JSON-like log file format. Default false |
-e, --log-level | Log level (trace, debug, info, warn, error). Default info |
-l, --log-to-file | Log file. Default ./logs/collector-combined.log |
Direct Upload from the Collector to Artifactory
In case the collector cannot automatically send the coverage to Teamscale because of network restrictions, it can be configured to send the collected coverage directly to your Artifactory. The upload is enabled by setting the URL of the Artifactory server using parameter --artifactory-server-url, along with parameters that define the target partition and commit of the upload:
| Option | Description |
|---|---|
--artifactory-server-url | Upload the coverage to the given Artifactory server URL. The URL may include a subpath on the artifactory server, e.g. https://artifactory.example.com/my-repo/my/subpath. |
--artifactory-user | The user for uploading coverage to Artifactory. Only needed when not using the --artifactory-access-token option. |
--artifactory-password | The password for uploading coverage to Artifactory. Only needed when not using the --artifactory-access-token option. |
--artifactory-access-token | The access_token for uploading coverage to Artifactory. |
--artifactory-path-suffix | (optional): The path within the storage location between the default path and the uploaded artifact. |
Control API
The upload parameters of the coverage collector can be controlled and queried remotely via a REST API. This API is enabled using the command line parameter --enable-control-port. For example, starting the collector with --enable-control-port 9872 makes the API available on port 9872 via HTTP.
-c ENABLE_CONTROL_PORT, --enable-control-port ENABLE_CONTROL_PORTEnables the remote control API on the specified port (<=0 means "disabled"); disabled by default.
The following REST API methods are available:
[POST] /refreshInstructs the coverage collector to reload all configurations from the Teamscale server.[POST] /dumpInstructs the coverage collector to dump the collected coverage for all applications.[POST] /dump/{configId}Instructs the coverage collector to dump the collected coverage for all applications with the given config ID for which{configId}is a placeholder.[POST] /resetInstructs the coverage collector to reset the collected coverage for all applications. This will discard all coverage collected in the current session.[POST] /reset/{configId}Instructs the coverage collector to reset the collected coverage. This will discard all coverage collected for all applications with the given config ID.[POST] /stopInstructs the coverage collector to dump all collected coverage and to terminate itself.
Note that neither authentication nor transport encryption are required to control the collector. In case this is a strict requirement of your organization, please set up a corresponding reverse proxy that establishes and ensures these properties.
Troubleshooting
Collector: Unable To Verify The First Certificate
In many cases, coverage will be uploaded via HTTPS to Teamscale or other REST services that can receive coverage reports. By default, Node.js checks the certificates of these endpoints. That means that uploads to services, for which the certificate cannot be checked, fail with the error unable to verify the first certificate.
Setting the environment variable NODE_TLS_REJECT_UNAUTHORIZED to 0 for the Coverage Collector disables the check and is a workaround for this problem. Instead of failing, a warning will be shown in the log that hints at the disabled check.
We recommend setting up proper CA certificates via the environment variable NODE_EXTRA_CA_CERTS. More details can be found in the official Node.js documentation.
Instrumenter Runs Out Of Memory
In case the application to instrument is too big, the instrumenter might run out of memory. In this case, you can increase the memory available to Node.js by setting parameter max-old-space-size in the NODE_OPTIONS environment variable.
We recommend using the cross-env package for setting the NODE_OPTIONS in Node.js environments. For example, cross-env NODE_OPTIONS='--max-old-space-size=8192' npx @teamscale/javascript-instrumenter will increase the memory limit to 8GB for the given instrumenter invocation.
Instrumented App Is Slow
After instrumenting your application for recording coverage information, it might become significantly slower. One cause of this could be that not only the application code was instrumented, but also the code of the frameworks (for example, Angular or React) and other libraries.
We recommend instrumenting only that fraction of the application for which you would like to collect coverage information for. See Instrumentation Excludes.