Monitoring Settings
Teamscale allows seamless monitoring with Prometheus.
Configuration File
You can also configure all of these settings using a configuration file.
Monitoring Settings for Cloud-Hosted Instances
For instances hosted on our cloud platform, this setting is automatically configured and cannot be changed.
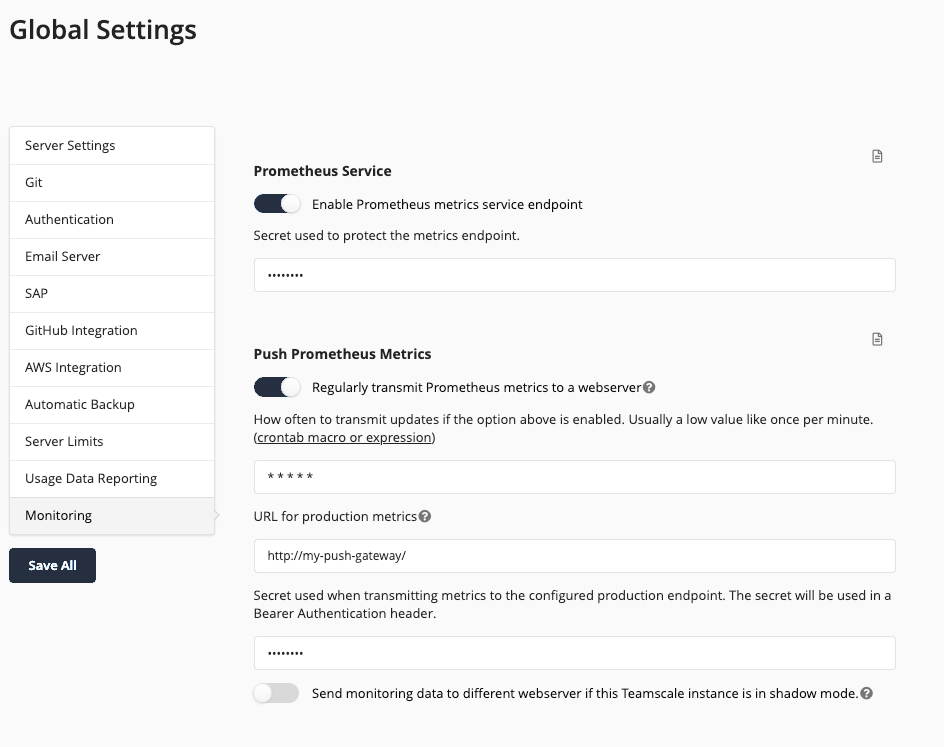
Prometheus Service
To enable this service, the option Enable Prometheus metrics service endpoint must be enabled. Additional protection of the metrics can be provided by option Secret used to protect the metrics endpoint. If this is set, the URL needs to be accessed with api/monitoring/prometheus?token=<secret-token>.
Furthermore, the environment variable TS_PROMETHEUS_METRICS_PREFIX can be used to define a common prefix for all exposed metrics.
Push Prometheus Metrics
In some situations, it might be impossible for the Prometheus instance to reach Teamscale's metrics endpoint. In such a case, we offer to push the metrics in regular intervals with the option Regularly transmit Prometheus metrics to a webserver. Administrators might find it necessary to monitor shadow instances separately from production instances, which is why we also support sending metrics to a different webserver, should the instance be in shadow mode. You can find more information on the concept of pushing metrics in the Prometheus documentation.