How to Set Up External Tools & Formats
abaplint
AbapLint binaries (version @abaplint/cli@2.113.232) are now shipped and dedicated to being used with Teamscale.
Teamscale comes with an AbapLint configuration that defaults to AbapLint's default values. You can adjust the rules settings to your needs in the Analysis Profile Edit View.
AbapLint is able to analyze ABAP files according to the version of the ABAP language. As Teamscale communicates with SAP systems, it is now able to lint ABAP files providing the appropriate language version. If you desire to use a different language version, locate its corresponding version type from AbapLint and provide it to the analysis profile using the option ABAPLint language version.
Additionally, you can import an AbapLint configuration file (abaplint.json) in the Analysis Profile View. This creates a new analysis profile that uses the settings from the configuration file.
If you like to use a fixed language version for the newly created analysis profile, you can provide it in the version field of the syntax section in the AbapLint configuration file. Otherwise, the field should be left blank. The value will be parsed into the option ABAPLint language version of the analysis profile.
NodeJS
ABAPLint requires that NodeJS version 16 or higher is deployed on your system and globally available by putting it to the PATH variable.
Bandit
Bandit is integrated into Teamscale as an internal analysis tool. Our docker-image distributions contain the correct bandit version, but distributions based on zip-files do not contain it. Instead, you will need to install Bandit on your machine. The required Bandit version is 1.7.7.
In addition, you will need to have a Python 3 distribution installed with the python3 executable on the PATH. This is included in our docker-image distributions as well.
BullseyeCoverage
See our detailed guide on C/C++ test coverage.
Clang Static Analyzer
The Open Source LLVM clang compiler includes a static analyzer that performs dataflow analysis on C/C++ code. Analysis is started using the scan-build script, which wraps the make process. To enable output in plist format (which we require), the option -plist must be passed to the scan-build command. Additionally, you might want to enable additional checkers using the -enable-checker command. To obtain a list of all available checkers, run the following command:
clang -cc1 -analyzer-checker-helpNote that it is sufficient to provide a package/category to the analyzer to enable more checks. A typical invocation of the static analyzer might look like this:
scan-build -plist
-enable-checker alpha
-enable-checker core
-enable-checker cplusplus
-enable-checker deadcode
-enable-checker security
-enable-checker unix
make
To upload analysis results, you should use the external-report service as described in our article on external uploads.
Clang Static Analyzer (via xcodebuild)
For XCode projects, Clang static analyzer can also run via the xcodebuild command or via XCode UI. For instance, the following command will generate an xcresult bundle which will contain Clang static analyzer results:
xcodebuild analyze -scheme MyScheme -resultBundlePath MyResults.xcresultAnd then the following command will extract a json file (which is the format supported in Teamscale) that should contain analyzer findings:
xcrun xcresulttool get build-results --path "path/to/MyResults.xcresult" > analyzer_results.jsonClang-Tidy
While Clang-Tidy is integrated as an internal analysis tool, the Clang-Tidy binaries are generally not shipped with Teamscale. Our docker-image distributions contain the correct clang-tidy version, but distributions based on zip-files do not contain clang-tidy. Instead, you will need to install clang-tidy 21.1.3 on your machine. More details are described here.
Cobertura
Cobertura is an Open Source code coverage tool for Java. Teamscale allows to upload XML coverage reports produced by Cobertura. You can generate an XML report with the Cobertura Ant task cobertura-report by setting the parameter format to xml as follows:
<cobertura-report format="xml"
	destdir="${coveragereport.dir}"
	srcdir="${src.dir}" />
For further details on the usage of the Cobertura Ant tasks, please refer to the Cobertura user manual.
To upload Cobertura coverage data, you should use the external-report service as described here.
Cppcheck (open-source)
While Cppcheck is integrated as an internal analysis tool, the Cppcheck binaries are generally not shipped with Teamscale. Our docker-image distributions contain the correct Cppcheck version, but distributions based on zip-files do not contain Cppcheck. Instead, you will need to install cppcheck-2.18.0 on your machine using the MSI installer (Windows) or compile it yourself (Linux, Mac)
Setup (only) for the Teamscale zip distribution:
- Install / Compile
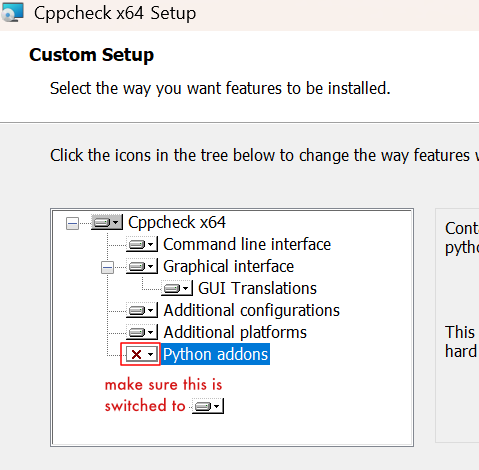
- Windows: Run the MSI installer. Make sure to also install the "Python addons" which are not installed by default.
- Linux / Mac: Compile Cppcheck as described in the official repository using the correct version 2.18.0. After compilation, make sure to also copy the other files and folders from the
buildfolder together with thecppcheckbinary.
- Windows: Run the MSI installer. Make sure to also install the "Python addons" which are not installed by default.
- Install Python 3 for the current user or globally. Make it available in the system's
PATHenvironment variable. Restart Teamscale. - Add the following JVM flag into
config/jvm.properties:
-Dcom.teamscale.cppcheck-exe="<absolute path to cppcheck binary>"- Windows only: If the Teamscale instance is running as a service, set an administrator account as logon user so that Teamscale can execute Cppcheck. To do so, right-click on the Teamscale service > “Properties”. On the Log On Tab, fill in the admin user details.

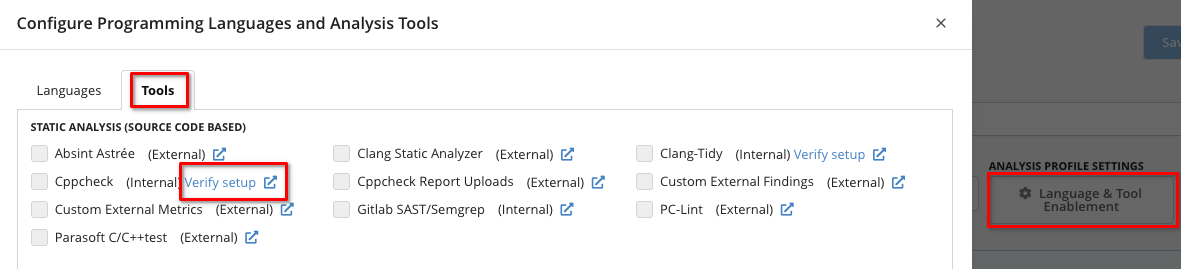
- Verify the setup via Analysis Profile > Tools > Cppcheck (internal) > Verify setup
More details are described here.
Cppcheck Premium
In addition to Cppcheck (open-source), Teamscale also integrates Cppcheck Premium. Teamscale docker-image distributions already contain the correct version of Cppcheck Premium.
Setup (if not using a docker-image distribution of Teamscale)
Make sure you have a Teamscale license that includes Cppcheck Premium. This will ensure that Cppcheck Premium is an integrated tool in Teamscale and becomes visible e.g. in C/C++ analysis profiles (see below).
- Contact Teamscale support to request the Cppcheck Premium zip archive for your Teamscale version.
- Extract the Cppcheck Premium zip archive to a path accessible by Teamscale. Please consider that Teamscale requires the whole folder, not just the Cppcheck Premium binary.
- Install Python 3 for the current user or globally. Make it available in the system's
PATHenvironment variable. Restart Teamscale. - Add the following JVM flag into
config/jvm.properties:-Dcom.teamscale.cppcheck-exe="<absolute path to cppcheck binary>" - Windows only: If the Teamscale instance is running as a service, set an administrator account as logon user so that Teamscale can execute Cppcheck Premium. To do so, right-click on the Teamscale service > “Properties”. On the Log On Tab, fill in the admin user details.
- Verify the setup via Analysis Profile > Tools > Cppcheck Premium (internal) > Verify setup

License
In order to enable Cppcheck Premium in Teamscale, a Teamscale license that includes Cppcheck Premium is required. Please contact our support for more information.
Dart Lint
The Dart linter is now integrated as an internal analysis tool with Teamscale. Our docker-image distributions contain the correct Dart SDK version, but distributions based on zip-files do not contain it. Instead, you will need to install Dart SDK on your machine, in order to use it, ensure you have version 3.5 or higher installed.
ESLint
While ESLint binaries are shipped with Teamscale, you will need to install the necessary NodeJS runtime on your machine. You will need to have the NodeJS binaries on the PATH and restart Teamscale before you can enable ESLint for your project.
The bundled ESLint distribution includes:
- @angular-eslint/eslint-plugin@17.1.1
- @angular-eslint/eslint-plugin-template@17.1.1
- @angular-eslint/template-parser@17.1.1
- @typescript-eslint/eslint-plugin@5.59.9
- @typescript-eslint/parser@5.59.9
- eslint@8.42.0
- eslint-plugin-jsx-a11y@6.8.0
- eslint-plugin-react@7.32.2
- eslint-plugin-security@2.1.0
- typescript@5.1.3
Teamscale comes with an ESLint configuration that defaults to ESLint's default values. You can still provide a custom ESLint config file in the analysis profile to adjust the rule's settings to your needs.
Configuration file security
For security reasons, Teamscale only reads ESLint configuration files from Teamscale's config directory. Additionally, only json, yml and yaml are allowed as valid ESLint configuration file extension by default. To enable JavaScript configuration files (e.g., .eslintrc.js), you can set -Dcom.teamscale.allow-executable-lint-config-file=true in the jvm.properties file.
This is discouraged because it can potentially lead to code execution on the Teamscale server via the configuration file.
FindBugs and SpotBugs
FindBugs is an Open Source bug pattern search tool working on the byte code of Java programs. This means that in order to use FindBugs, you have to first compile the code.
SpotBugs is the successor of FindBugs, which is no longer maintained. Since SpotBugs reports are compatible with the FindBugs report format, they can be uploaded with the same analysis-tool name (FINDBUGS). To upload analysis results, you should use the external-report service as described here.
Flake8
While Flake8 is integrated as an internal analysis tool, Flake8 files are generally not shipped with Teamscale. Our docker-image distributions contain the correct Flake8 version, but distributions based on zip-files do not contain it. Instead, you will need to install Flake8 on your machine.
The required Flake8 and plugin versions are:
- flake8 6.1.0
- includes mccabe 0.7.0, pycodestyle 2.11.1, and pyflakes 3.1.0
- flake8-bugbear 23.11.26
In addition, you will need to have a Python 3 distribution installed with the python3 executable on the PATH. This is included in our docker-image distributions as well.
gcov
The tool gcov measures line coverage for C/C++ code compiled with the GCC compiler. Please see our gcov how-to for how to set up these tools and upload coverage to Teamscale.
Golangci-lint
Golangci-lint is a fast linters runner for the Go language. It is integrated into Teamscale as an internal analysis tool. Docker-image distributions of Teamscale contain Golangci-lint but distributions based on zip-files don't. If using these distributions, it is required to install Golangci-lint and the Go language on the machine and make them available on the system's path.
helm
helm is needed for Teamscale's Kubernetes Analysis. It is included in our Docker Image but needs to be installed separately when using the ZIP distribution. Teamscale does not require a specific version - we recommend using the latest version. Please read the official setup guide or directly download the binaries. You can either put the binary on the PATH or use the JVM argument com.teamscale.worker.helm-executable.
JaCoCo
JaCoCo is an Open Source code coverage tool for Java. Teamscale allows to upload XML coverage reports produced by JaCoCo. Please refer to our Java test coverage guide for instructions on how to set up JaCoCo for your tests.
To upload JaCoCo coverage data, you should use the external-report service as described here.
kube-score
kube-score is needed for Teamscale's Kubernetes Analysis. It is included in our Docker Image but needs to be installed separately when using the ZIP distribution. Teamscale requires version 1.19.0, which you can download from GitHub. You can either put the binary on the PATH or use the JVM argument com.teamscale.worker.kube-score-executable.
kustomize
kustomize is needed for Teamscale's Kubernetes Analysis. It is included in our Docker Image but needs to be installed separately when using the ZIP distribution. Teamscale does not require a specific version - we recommend using the latest version. Please read the official setup guide or directly download the binaries. You can either put the binary on the PATH or use the JVM argument com.teamscale.worker.kustomize-executable.
Parasoft C/C++test
The reports from Parasoft C/C++test are fully self-contained. The content and structure, however, depend completely on the configuration of the tool. Hence, before the first import of such a report, the findings need to be made known to Teamscale using the following steps:
- Create a new analysis profile (e.g., called
CppWithParasoft) with Parasoft C/C++test enabled in the tools section - Call the following service to upload the report and update the analysis profile:
curl -X POST -F report=@parasoft.xml 'http://<teamscale-url>/api/external-findings/descriptions/from-parasoft-report?analysis-profile=CppWithParasoft'- The analysis profile should now be updated with rules and can be adjusted if needed
- Create a project with the updated analysis profile
PC-lint/FlexeLint
PC-lint is a static analysis tool for C/C++ that covers a wide range of checks. To import PC-lint analysis results in Teamscale, you need to generate an XML report using the +xml parameter from PC-lint. For details, please refer to the documentation of PC-lint.
The check descriptions in Teamscale are up-to-date with PC-lint version 9.00L (i.e., Teamscale can import and display findings from a report generated by this PC-lint version).
PHPStan
PHPStan is now integrated as an internal analysis tool with Teamscale. PHPStan requires PHP 7.2 or higher. In case your project manages its dependencies via composer, Teamscale will try to resolve these dependencies during analysis. For this, composer version 2.2 or higher is required. Our docker-image distributions contain the latest PHP and composer version, but distributions based on zip-files do not contain it. Instead, you will need to install PHP (and composer) on your machine.
Rule Levels
The idea of PHPStan is to use a so-called "Rule Level" instead of specifying the checks to execute. The higher the level, the more stricter checks are enabled. By default, Teamscale uses the max level and filters out any findings of disabled checks. However, if required, it is possible to change the rule level Teamscale uses in the advanced settings of the analysis profile. Please note, in this case, PHPStan does not execute higher level checks, even though they are enabled in the analysis profile.
PowerShell Script Analyzer (PSScriptAnalyzer)
While the PowerShell Script Analyzer is integrated as an internal analysis tool, its binaries are generally not shipped with Teamscale. Our docker-image distributions contain the correct version of PowerShellScriptAnalyzer, but distributions based on zip-files do not contain the tool. Instead, you will need to install PowerShell and PSScriptAnalyzer version 1.21.0 on your Teamscale server. More details are described here.
Pylint
Pylint is an Open Source code analysis tool for Python working directly on the source code.
The check descriptions in Teamscale are up-to-date with pylint 3.0.3 (i.e., Teamscale can import and display findings from a report generated by this version). To import Pylint analysis results into Teamscale, you need to create the generated report using a special format. This can be achieved by using the following command line call:
pylint --score=no --reports=no --msg-template='line: {line}, messageId: {msg_id}, message: {msg}, absolutePath: {abspath}, messageName: {symbol}' /path/to/python/files > report.jsonThis command generates a plain text format which can be uploaded to Teamscale, either via the external uploads view for your project or simply using curl via the REST interface (endpoints: api/projects/{project}/external-analysis/session/*). Please ensure to use the above message template without any changes.
Please note that while Pylint is capable of generating a JSON report, this cannot be used for Teamscale as does not contain all information necessary to seamlessly integrate the report into Teamscale.
Semgrep
Semgrep is integrated into Teamscale as an internal analysis tool. Our docker-image distributions contain the correct semgrep version, but distributions based on zip-files do not contain it. Instead, you will need to install semgrep on your machine. The required semgrep version is 1.92.0.
SonarLint for JavaScript / TypeScript
SonarLint for other languages
This section is only relevant for SonarLint for JavaScript / TypeScript. Analyzing other languages (e.g. Java or PHP) with SonarLint works without any additional setup.
Starting with Teamscale 9.7, SonarLint for JavaScript & TypeScript is available as internal tool in Teamscale. This means SonarLint can be added to an analysis profile in the Analysis Profile Editor and Teamscale will automatically execute it for every commit.
When you are using Teamscale with Docker (recommended), no further setup is required.
When you are NOT running Teamscale's Docker image, executing the SonarLint for JavaScript / TypeScript binaries requires NodeJS in version 14.17 or higher on your machine. You will need to have the NodeJS binary on the PATH and restart Teamscale before you can enable checks by SonarLint for JavaScript / TypeScript for your project.
SwiftLint
SwiftLint is a tool to check Swift code for adherence to style guides and conventions. While SwiftLint is integrated as an internal analysis tool, SwiftLint files are generally not shipped with Teamscale. Our docker-image distributions contain the correct SwiftLint version, but distributions based on zip-files do not contain it. Instead, you need to install SwiftLint on the Teamscale analysis server and ensure that the swiftlint executable is on the path. The required SwiftLint version is 0.61.0.
TSLint
Removed
TSLint support has been removed with Teamscale 8.2. Most of the TSLint checks are available via ESLint now. See the TSLint deprecation blog for an overview of ESLint checks that replace TSLint checks.
XCode Test Coverage
Test coverage for XCode projects is recorded in an XCResult bundle in a binary format. Teamscale supports importing the contained line-based test coverage by exporting it in a textual format using the xccov command line tool. For XCode 13.3 and above the coverage can be exported in a textual format using the following command:
xcrun xccov view --archive path/to/some.xcresultFor XCode 13.2 and below the XCode tooling cannot produce a comprehensive report with line coverage information for all files in a project, the following shell script must be used to obtain a coverage report that can be imported into Teamscale:
#!/bin/bash
if [ $# -eq 0 ]
  then
  echo "Please provide path to xccovarchive directory"
  exit 1
fi
archive="$1"

coverage=""
files=$(xcrun xccov view --archive --file-list "$archive")
while read -r file; do
  coverage+="$file"
  coverage+=$'\n'
  coverage+="$(xcrun xccov view --archive "$archive" --file "$file"):"
  coverage+=$'\n'
done <<< "$files"
echo "${coverage}"
In both cases the command will output the coverage report to standard out. You can pipe the output into a file which can then be uploaded via the REST API as described here.
Note that the Teamscale Upload tool provides an easy to use automatic conversion of the XCResult bundle. Any *.xcresult, *.xcresult.tar, *.xcresult.tar.gz or *.xcresult.tgz file can be passed as a report with format XCODE to the tool and it will perform automatic conversion to the right format before upload.
XCode XCTest test execution data
Besides coverage, XCTest result files (*.xcresult) also contain test execution data. To import this data to Teamscale, the following command can be used to generate a report in JSON format:
xcrun xcresulttool get --path <xcresult-file> --format jsonThe generated *.json file should contain an explicit testsRef ID, e.g. 0~pYxLsSwT2harDbBkwHOemYmrig4tejMoZIDzYaRhN1_YDV6VNk01K24YhzwGOQTd5yIr4raTPhFhE3DPlKwG_Q==. This ID should be used in the following script to obtain the final report file:
xcrun xcresulttool get --path <xcresult-file> --format json --id "<id>"This resulting *.json file can then be uploaded to Teamscale as a XCode JSON test execution report. This can be done analogously to test execution reports as described here.
Mapping of status "Expected Failure"
Currently Teamscale does not support the test execution status "Expected Failure" as a separate status category. The test cases with this outcome are stored as "Successful". The reason is that if a test case fails expectedly, then it behaves as specified.